Unknown entries from news log file:
First 18 / 18 lines (100.0%)
Log entries by program:
| Program name | Lines | %Lines | Size | %Size |
|---|---|---|---|---|
| inn | 454700 | 97.9% | 58.2 MB | 97.6% |
| innd | 8331 | 1.8% | 1.2 MB | 2.1% |
| innfeed | 1380 | 0.3% | 189.2 KB | 0.3% |
| cnfsstat | 144 | 0.0% | 28.4 KB | 0.0% |
| nnrpd | 62 | 0.0% | 6.3 KB | 0.0% |
| thermald | 17 | 0.0% | 1.7 KB | 0.0% |
| controlchan | 2 | 0.0% | 0.1 KB | 0.0% |
| overchan | 1 | 0.0% | 0.1 KB | 0.0% |
| TOTAL: 8 | 464637 | 100.0% | 59.7 MB | 100.0% |
History cache:
| Reason | Count | %Count |
|---|---|---|
| Negative hits | 721134 | 44.1% |
| Positive hits | 464898 | 28.4% |
| Do not exist | 441764 | 27.0% |
| Cache misses | 8249 | 0.5% |
| TOTAL: 4 | 1636045 | 100.0% |
INND timer:
| Code region | Time | Pct | Invoked | Min(ms) | Avg(ms) | Max(ms) |
|---|---|---|---|---|---|---|
| article cancel | 00:00:00.001 | 0.0% | 26 | 0.000 | 0.038 | 1.000 |
| article cleanup | 00:00:04.737 | 0.0% | 403973 | 0.004 | 0.012 | 0.018 |
| article logging | 00:00:17.031 | 0.0% | 404246 | 0.023 | 0.042 | 0.052 |
| article parse | 00:00:38.031 | 0.0% | 1475880 | 0.010 | 0.026 | 0.038 |
| article write | 00:00:22.644 | 0.0% | 230240 | 0.048 | 0.098 | 0.136 |
| artlog/artparse | 00:00:02.440 | 0.0% | 48577 | 0.021 | 0.050 | 0.098 |
| data move | 00:00:12.500 | 0.0% | 1628065 | 0.001 | 0.008 | 0.015 |
| hisgrep/artcncl | 00:00:00.000 | 0.0% | 26 | 0.000 | 0.000 | 0.000 |
| history grep | 00:00:00.000 | 0.0% | 0 | 0.000 | 0.000 | 0.000 |
| history lookup | 00:00:25.463 | 0.0% | 1643025 | 0.003 | 0.015 | 0.199 |
| history sync | 00:00:00.024 | 0.0% | 308 | 0.000 | 0.078 | 1.000 |
| history write | 00:00:29.295 | 0.0% | 442847 | 0.045 | 0.066 | 0.091 |
| idle | 23:40:32.881 | 99.3% | 1267241 | 42.956 | 67.259 | 120.878 |
| nntp read | 00:00:57.680 | 0.1% | 1268254 | 0.023 | 0.045 | 0.062 |
| overview write | 00:00:01.277 | 0.0% | 230240 | 0.001 | 0.006 | 0.014 |
| perl filter | 00:00:21.373 | 0.0% | 395002 | 0.030 | 0.054 | 0.071 |
| python filter | 00:00:21.189 | 0.0% | 395002 | 0.027 | 0.054 | 0.072 |
| site send | 00:00:09.563 | 0.0% | 527164 | 0.009 | 0.018 | 0.210 |
| TOTAL: 23:50:21.646 | 23:44:56.129 | 99.6% | - | - | - | - |
INNfeed timer:
| Code region | Time | Pct | Invoked | Min(ms) | Avg(ms) | Max(ms) |
|---|---|---|---|---|---|---|
| article new | 00:00:00.246 | 0.0% | 66644 | 0.000 | 0.004 | 0.021 |
| article prepare | 00:00:00.003 | 0.0% | 1026 | 0.000 | 0.003 | 1.000 |
| article read | 00:00:00.056 | 0.0% | 618 | 0.000 | 0.091 | 1.000 |
| backlog stats | 00:00:00.233 | 0.0% | 215328 | 0.000 | 0.001 | 0.004 |
| callbacks | 00:00:00.000 | 0.0% | 0 | 0.000 | 0.000 | 0.000 |
| data read | 00:00:03.688 | 0.0% | 140735 | 0.006 | 0.026 | 0.048 |
| data write | 00:00:03.435 | 0.0% | 87507 | 0.019 | 0.039 | 0.097 |
| idle | 23:42:52.476 | 100.0% | 215328 | 111.895 | 396.476 | 1524.574 |
| status file | 00:00:00.159 | 0.0% | 243 | 0.000 | 0.654 | 1.000 |
| TOTAL: 23:43:23.304 | 23:43:00.296 | 100.0% | - | - | - | - |
nnrpd timer:
| Code region | Time | Pct | Invoked | Min(ms) | Avg(ms) | Max(ms) |
|---|---|---|---|---|---|---|
| idle | 00:00:00.000 | 0.0% | 0 | 0.000 | 0.000 | 0.000 |
| newnews | 00:00:00.000 | 0.0% | 0 | 0.000 | 0.000 | 0.000 |
| nntpwrite | 00:00:00.000 | 0.0% | 13 | 0.000 | 0.000 | 0.000 |
| TOTAL: 00:01:19.561 | 00:00:00.000 | 0.0% | - | - | - | - |
Control commands to INND:
| Command | Number |
|---|---|
| flush | 5 |
| flushlogs | 2 |
| go | 2 |
| logmode | 2 |
| lowmark | 1 |
| mode | 147 |
| name | 2 |
| pause | 2 |
| paused | 2 |
| reload | 48 |
| reserve | 2 |
| TOTAL: 11 | 215 |
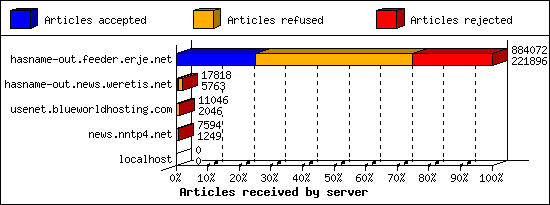
Incoming Feeds (INN):
| Server | Connects | Offered | Taken | Refused | Reject | %Accpt | Elapsed | |
|---|---|---|---|---|---|---|---|---|
| 1 | hasname-out.feeder.erje.net | 578 | 884072 | 221896 | 439635 | 222541 | 25% | 47:46:00 |
| 2 | hasname-out.news.weretis.net | 5 | 17818 | 5763 | 11993 | 62 | 32% | 46:08:34 |
| 3 | usenet.blueworldhosting.com | 721 | 11046 | 2046 | 8790 | 210 | 18% | 23:38:35 |
| 4 | news.nntp4.net | 2 | 7594 | 1249 | 6156 | 189 | 16% | 22:50:32 |
| 5 | localhost | 1 | 0 | 0 | 0 | 0 | 0% | 00:00:00 |
| TOTAL: 5 | 1307 | 920530 | 230954 | 466574 | 223002 | 25% | 140:23:41 | |
Incoming Volume (INN):
| Server | AcceptVol | DupVol | RejVol | TotalVol | %Acc | Vol/Art | |
|---|---|---|---|---|---|---|---|
| 1 | hasname-out.feeder.erje.net | 2.5 GB | 103.4 MB | 2.7 GB | 5.3 GB | 46% | 12.6 KB |
| 2 | hasname-out.news.weretis.net | 13.3 MB | 108.1 KB | 50.6 KB | 13.4 MB | 98% | 2.4 KB |
| 3 | news.nntp4.net | 6.1 MB | 27.2 KB | 1.5 MB | 7.7 MB | 79% | 5.5 KB |
| 4 | usenet.blueworldhosting.com | 4.0 MB | 4.6 KB | 1.4 MB | 5.4 MB | 73% | 2.5 KB |
| 5 | localhost | 0.0 KB | 0.0 KB | 0.0 KB | 0.0 KB | 0% | 0 |
| TOTAL: 5 | 2.5 GB | 103.5 MB | 2.7 GB | 5.3 GB | 47% | 12.4 KB | |

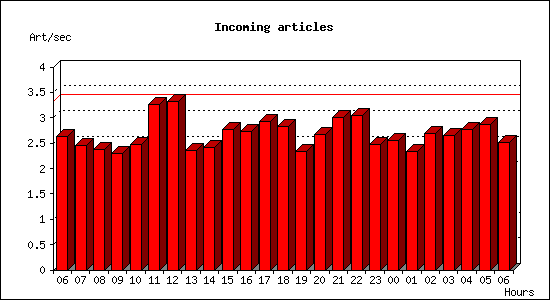
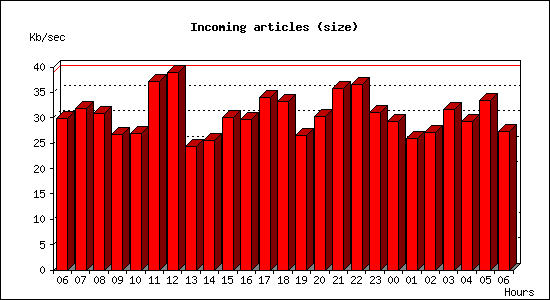
Incoming articles:
| Date | Articles | %Arts | Art/sec | Size | %Size | KB/sec |
|---|---|---|---|---|---|---|
| Sep 23 06:01:02 - 06:59:59 | 9309 | 4.0% | 2.63 | 103.4 MB | 4.0% | 29.92 |
| Sep 23 07:00:00 - 07:59:59 | 8817 | 3.8% | 2.45 | 111.7 MB | 4.3% | 31.77 |
| Sep 23 08:00:00 - 08:59:59 | 8552 | 3.7% | 2.38 | 108.8 MB | 4.2% | 30.93 |
| Sep 23 09:00:00 - 09:59:59 | 8273 | 3.6% | 2.30 | 94.0 MB | 3.6% | 26.74 |
| Sep 23 10:00:00 - 10:59:59 | 8926 | 3.9% | 2.48 | 94.6 MB | 3.7% | 26.91 |
| Sep 23 11:00:00 - 11:59:59 | 11757 | 5.1% | 3.27 | 130.6 MB | 5.0% | 37.15 |
| Sep 23 12:00:00 - 12:59:59 | 11984 | 5.2% | 3.33 | 137.0 MB | 5.3% | 38.96 |
| Sep 23 13:00:00 - 13:59:59 | 8500 | 3.7% | 2.36 | 85.8 MB | 3.3% | 24.40 |
| Sep 23 14:00:00 - 14:59:59 | 8723 | 3.8% | 2.42 | 89.8 MB | 3.5% | 25.54 |
| Sep 23 15:00:00 - 15:59:59 | 9983 | 4.3% | 2.77 | 105.6 MB | 4.1% | 30.03 |
| Sep 23 16:00:00 - 16:59:59 | 9849 | 4.3% | 2.74 | 104.6 MB | 4.0% | 29.75 |
| Sep 23 17:00:00 - 17:59:59 | 10508 | 4.5% | 2.92 | 119.5 MB | 4.6% | 33.99 |
| Sep 23 18:00:00 - 18:59:59 | 10205 | 4.4% | 2.83 | 116.6 MB | 4.5% | 33.16 |
| Sep 23 19:00:00 - 19:59:59 | 8434 | 3.6% | 2.34 | 93.3 MB | 3.6% | 26.54 |
| Sep 23 20:00:00 - 20:59:59 | 9629 | 4.2% | 2.67 | 106.5 MB | 4.1% | 30.29 |
| Sep 23 21:00:00 - 21:59:59 | 10785 | 4.7% | 3.00 | 125.8 MB | 4.9% | 35.80 |
| Sep 23 22:00:00 - 22:59:59 | 10975 | 4.7% | 3.05 | 128.6 MB | 5.0% | 36.58 |
| Sep 23 23:00:00 - 23:59:59 | 8897 | 3.8% | 2.47 | 109.1 MB | 4.2% | 31.04 |
| Sep 24 00:00:00 - 00:59:59 | 9160 | 4.0% | 2.54 | 103.1 MB | 4.0% | 29.33 |
| Sep 24 01:00:00 - 01:59:59 | 8433 | 3.6% | 2.34 | 91.0 MB | 3.5% | 25.89 |
| Sep 24 02:00:00 - 02:59:59 | 9705 | 4.2% | 2.70 | 95.0 MB | 3.7% | 27.02 |
| Sep 24 03:00:00 - 03:59:59 | 9569 | 4.1% | 2.66 | 110.9 MB | 4.3% | 31.54 |
| Sep 24 04:00:00 - 04:59:59 | 9946 | 4.3% | 2.76 | 102.8 MB | 4.0% | 29.24 |
| Sep 24 05:00:00 - 05:59:59 | 10351 | 4.5% | 2.88 | 117.7 MB | 4.5% | 33.47 |
| Sep 24 06:00:00 - 06:01:01 | 153 | 0.1% | 2.51 | 1.6 MB | 0.1% | 27.22 |
| TOTAL: 23:59:59 | 231423 | 100.0% | 2.68 | 2.5 GB | 100.0% | 30.66 |
CNFS buffer status:
| Buffer | Class | Size | Used | %Used | Cycles | KB/sec | Days |
|---|---|---|---|---|---|---|---|
| C1 | DEFAULT | 10.0 GB | 4.2 GB | 41.9% | 83 | 36.03 | 3.37 |
| TOTAL: 1 | - | 10.0 GB | 4.2 GB | 41.9% | 83 | 36.03 | - |
Sites sending bad articles:
| Server | Total | Group | Dist | Duplic | Unapp | TooOld | Site | Line | Other | |
|---|---|---|---|---|---|---|---|---|---|---|
| 1 | hasname-out.feeder.erje.net | 222657 | 164871 | 0 | 8949 | 17 | 0 | 0 | 0 | 48820 |
| 2 | news.nntp4.net | 310 | 211 | 0 | 9 | 0 | 0 | 0 | 0 | 90 |
| 3 | usenet.blueworldhosting.com | 230 | 206 | 0 | 1 | 0 | 0 | 0 | 0 | 23 |
| 4 | hasname-out.news.weretis.net | 80 | 25 | 0 | 42 | 0 | 0 | 0 | 0 | 13 |
| TOTAL: 4 | 223277 | 165313 | 0 | 9001 | 17 | 0 | 0 | 0 | 48946 | |
Unwanted newsgroups [Top 20]:
| Newsgroup | Count |
|---|---|
| alt.binaries.friends | 45791 |
| alt.binaries.encryptnzb.juliet | 4829 |
| alt.binaries.encryptnzb.echo | 4810 |
| alt.binaries.encryptnzb.lima | 4778 |
| alt.binaries.encryptnzb.charlie | 4764 |
| alt.binaries.encryptnzb.hotel | 4706 |
| alt.binaries.encryptnzb.delta | 4698 |
| alt.binaries.encryptnzb.golf | 4670 |
| alt.binaries.encryptnzb.bravo | 4667 |
| alt.binaries.encryptnzb.beta | 4658 |
| alt.binaries.encryptnzb.mike | 4657 |
| alt.binaries.encryptnzb.india | 4655 |
| alt.binaries.encryptnzb.kilo | 4651 |
| alt.binaries.encryptnzb.novemeber | 4640 |
| alt.binaries.encryptnzb.alpha | 4621 |
| alt.binaries.encryptnzb.foxtrot | 4520 |
| alt.binaries.encrypted | 3172 |
| alt.binaries.fta | 1798 |
| alt.binaries.wtfnzb.alpha | 1646 |
| alt.binaries.wtfnzb.foxtrot | 1627 |
| TOTAL: 218 | 165313 |
Supposedly-moderated groups with unmoderated postings [Top 20]:
| Groups | Count |
|---|---|
| alt.binaries.whitburn | 17 |
| TOTAL: 1 | 17 |
INND no permission servers:
| System | Conn |
|---|---|
| 103.193.138.76 | 30 |
| 147.185.132.0 | 2 |
| 147.185.132.101 | 2 |
| 147.185.132.77 | 2 |
| 35.203.211.58 | 2 |
| 167.94.138.36 | 1 |
| 79.124.49.210 | 1 |
| TOTAL: 7 | 40 |
Miscellaneous innd statistics [Top 10]:
| Event | Server | Number |
|---|---|---|
| Bad Message-ID's offered | ||
| hasname-out.feeder.erje.net | 40 | |
| TOTAL: 1 | 40 | |
| Including strange strings | ||
| hasname-out.feeder.erje.net | 154 | |
| news.nntp4.net | 90 | |
| usenet.blueworldhosting.com | 20 | |
| hasname-out.news.weretis.net | 13 | |
| TOTAL: 4 | 277 | |
| No colon-space in header field | ||
| hasname-out.feeder.erje.net | 1749 | |
| TOTAL: 1 | 1749 | |
| TOTAL: 3 | 2066 | |
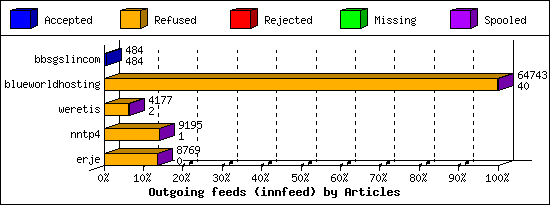
Outgoing Feeds (innfeed) by Articles:
| Server | Offered | Taken | Refused | Reject | Miss | Spool | %Took | Elapsed | |
|---|---|---|---|---|---|---|---|---|---|
| 1 | bbsgslincom | 484 | 484 | 0 | 0 | 0 | 0 | 100% | 21:47:42 |
| 2 | blueworldhosting | 65559 | 40 | 64663 | 1 | 0 | 39 | 0% | 23:55:50 |
| 3 | weretis | 4157 | 2 | 4052 | 94 | 0 | 29 | 0% | 23:46:41 |
| 4 | nntp4 | 9159 | 1 | 9147 | 0 | 0 | 47 | 0% | 23:46:42 |
| 5 | erje | 8718 | 0 | 8718 | 0 | 0 | 51 | 0% | 23:56:06 |
| TOTAL: 5 | 88077 | 527 | 86580 | 95 | 0 | 166 | 0% | 117:13:01 | |
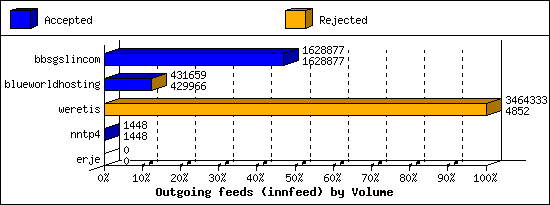
Outgoing Feeds (innfeed) by Volume:
| Server | AcceptVol | RejectVol | TotalVol | Volume/sec | Vol/Art | Elapsed | |
|---|---|---|---|---|---|---|---|
| 1 | bbsgslincom | 1.6 MB | 0.0 KB | 1.6 MB | 0.0 KB/s | 3.3 KB | 21:47:42 |
| 2 | blueworldhosting | 419.9 KB | 1.7 KB | 421.5 KB | 0.0 KB/s | 10.3 KB | 23:55:50 |
| 3 | weretis | 4.7 KB | 3.3 MB | 3.3 MB | 0.0 KB/s | 35.2 KB | 23:46:41 |
| 4 | nntp4 | 1.4 KB | 0.0 KB | 1.4 KB | 0.0 KB/s | 1.4 KB | 23:46:42 |
| 5 | erje | 0.0 KB | 0.0 KB | 0.0 KB | 0.0 KB/s | 0 | 23:56:06 |
| TOTAL: 5 | 2.0 MB | 3.3 MB | 5.3 MB | 0.0 KB/s | 8.7 KB | 117:13:01 | |
NNRP total resource statistics [Top 20]:
| System | User(ms) | System(ms) | Idle(ms) | Elapsed |
|---|---|---|---|---|
| 164.52.24.190 | 0.004 | 0.021 | 0.000 | 00:01:16 |
| 165.154.246.251 | 0.002 | 0.003 | 0.000 | 00:00:01 |
| 91.238.181.94 | 0.001 | 0.003 | 0.000 | 00:00:00 |
| o68.scanner.modat.io | 0.003 | 0.001 | 0.000 | 00:00:00 |
| azpdsgrs9c08.stretchoid.com | 0.003 | 0.005 | 0.000 | 00:00:00 |
| 198.235.24.114 | 0.000 | 0.001 | 0.000 | 00:00:00 |
| 205.210.31.212 | 0.001 | 0.003 | 0.000 | 00:00:00 |
| TOTAL: 7 | 0.014 | 0.037 | 0.000 | 00:01:19 |
NNRP no permission clients [Top 20]:
| System | Conn |
|---|---|
| 164.52.24.190 | 6 |
| azpdsgrs9c08.stretchoid.com | 2 |
| 165.154.246.251 | 1 |
| 198.235.24.114 | 1 |
| 205.210.31.212 | 1 |
| 91.238.181.94 | 1 |
| o68.scanner.modat.io | 1 |
| TOTAL: 7 | 13 |