Unknown entries from news log file:
First 2 / 2 lines (100.0%)
Log entries by program:
| Program name | Lines | %Lines | Size | %Size |
|---|---|---|---|---|
| inn | 503419 | 97.5% | 61.7 MB | 97.0% |
| innd | 11421 | 2.2% | 1.6 MB | 2.6% |
| innfeed | 1374 | 0.3% | 206.3 KB | 0.3% |
| cnfsstat | 144 | 0.0% | 22.7 KB | 0.0% |
| nnrpd | 79 | 0.0% | 8.2 KB | 0.0% |
| controlchan | 12 | 0.0% | 2.6 KB | 0.0% |
| overchan | 1 | 0.0% | 0.1 KB | 0.0% |
| pgpverify | 1 | 0.0% | 0.1 KB | 0.0% |
| TOTAL: 8 | 516451 | 100.0% | 63.5 MB | 100.0% |
History cache:
| Reason | Count | %Count |
|---|---|---|
| Negative hits | 784823 | 44.6% |
| Do not exist | 492276 | 28.0% |
| Positive hits | 470465 | 26.7% |
| Cache misses | 11983 | 0.7% |
| TOTAL: 4 | 1759547 | 100.0% |
INND timer:
| Code region | Time | Pct | Invoked | Min(ms) | Avg(ms) | Max(ms) |
|---|---|---|---|---|---|---|
| article cancel | 00:00:00.006 | 0.0% | 45 | 0.000 | 0.133 | 1.000 |
| article cleanup | 00:00:05.257 | 0.0% | 498681 | 0.005 | 0.011 | 0.016 |
| article logging | 00:00:19.565 | 0.0% | 498805 | 0.021 | 0.039 | 0.128 |
| article parse | 00:00:29.708 | 0.0% | 1463045 | 0.007 | 0.020 | 0.026 |
| article write | 00:00:29.406 | 0.0% | 337785 | 0.053 | 0.087 | 0.119 |
| artlog/artparse | 00:00:00.240 | 0.0% | 4515 | 0.000 | 0.053 | 0.500 |
| data move | 00:00:02.731 | 0.0% | 1555648 | 0.001 | 0.002 | 0.005 |
| hisgrep/artcncl | 00:00:00.003 | 0.0% | 45 | 0.000 | 0.067 | 1.000 |
| history grep | 00:00:00.000 | 0.0% | 0 | 0.000 | 0.000 | 0.000 |
| history lookup | 00:00:52.224 | 0.1% | 1760852 | 0.002 | 0.030 | 1.580 |
| history sync | 00:00:00.025 | 0.0% | 299 | 0.000 | 0.084 | 1.000 |
| history write | 00:00:28.690 | 0.0% | 491701 | 0.033 | 0.058 | 0.076 |
| idle | 23:51:58.539 | 99.4% | 1219304 | 18.503 | 70.465 | 139.200 |
| nntp read | 00:00:45.488 | 0.1% | 1220357 | 0.015 | 0.037 | 0.052 |
| overview write | 00:00:01.819 | 0.0% | 337785 | 0.001 | 0.005 | 0.012 |
| perl filter | 00:00:23.720 | 0.0% | 487322 | 0.024 | 0.049 | 0.071 |
| python filter | 00:00:23.194 | 0.0% | 487322 | 0.026 | 0.048 | 0.067 |
| site send | 00:00:12.360 | 0.0% | 756047 | 0.010 | 0.016 | 0.139 |
| TOTAL: 24:00:15.690 | 23:56:32.975 | 99.7% | - | - | - | - |
INNfeed timer:
| Code region | Time | Pct | Invoked | Min(ms) | Avg(ms) | Max(ms) |
|---|---|---|---|---|---|---|
| article new | 00:00:00.261 | 0.0% | 80513 | 0.000 | 0.003 | 0.018 |
| article prepare | 00:00:00.001 | 0.0% | 2056 | 0.000 | 0.000 | 0.001 |
| article read | 00:00:00.082 | 0.0% | 886 | 0.000 | 0.093 | 1.000 |
| backlog stats | 00:00:00.218 | 0.0% | 250977 | 0.000 | 0.001 | 0.005 |
| callbacks | 00:00:00.000 | 0.0% | 0 | 0.000 | 0.000 | 0.000 |
| data read | 00:00:04.165 | 0.0% | 161556 | 0.011 | 0.026 | 0.047 |
| data write | 00:00:03.533 | 0.0% | 102943 | 0.015 | 0.034 | 0.076 |
| idle | 23:53:43.705 | 100.0% | 250977 | 57.245 | 342.755 | 1395.360 |
| status file | 00:00:00.153 | 0.0% | 244 | 0.000 | 0.627 | 1.286 |
| TOTAL: 23:54:00.018 | 23:53:52.118 | 100.0% | - | - | - | - |
nnrpd timer:
| Code region | Time | Pct | Invoked | Min(ms) | Avg(ms) | Max(ms) |
|---|---|---|---|---|---|---|
| idle | 00:00:00.000 | 0.0% | 0 | 0.000 | 0.000 | 0.000 |
| newnews | 00:00:00.000 | 0.0% | 0 | 0.000 | 0.000 | 0.000 |
| nntpwrite | 00:00:00.000 | 0.0% | 17 | 0.000 | 0.000 | 0.000 |
| TOTAL: 00:00:06.528 | 00:00:00.000 | 0.0% | - | - | - | - |
Control commands to INND:
| Command | Number |
|---|---|
| flush | 5 |
| flushlogs | 2 |
| go | 2 |
| logmode | 2 |
| lowmark | 1 |
| mode | 146 |
| name | 2 |
| pause | 2 |
| paused | 2 |
| reload | 48 |
| reserve | 2 |
| TOTAL: 11 | 214 |
Control Channel:
| Sender | newgroup | rmgroup | Other | Bad PGP | DoIt | OK |
|---|---|---|---|---|---|---|
| nl-admin@nic.surfnet.nl | 0 | 0 | 1 | 1 | 0 | 1 |
| TOTAL | 0 | 0 | 1 | 1 | 0 | 1 |
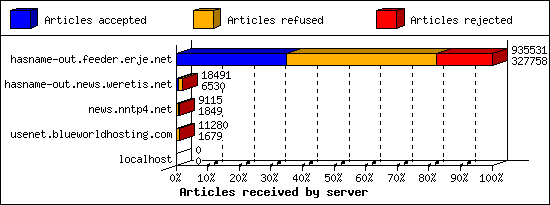
Incoming Feeds (INN):
| Server | Connects | Offered | Taken | Refused | Reject | %Accpt | Elapsed | |
|---|---|---|---|---|---|---|---|---|
| 1 | hasname-out.feeder.erje.net | 576 | 935531 | 327758 | 442956 | 164817 | 35% | 49:29:08 |
| 2 | hasname-out.news.weretis.net | 4 | 18491 | 6530 | 11884 | 77 | 35% | 48:29:04 |
| 3 | news.nntp4.net | 2 | 9115 | 1849 | 6983 | 283 | 20% | 24:09:01 |
| 4 | usenet.blueworldhosting.com | 1394 | 11280 | 1679 | 9450 | 151 | 14% | 23:48:07 |
| 5 | localhost | 1 | 0 | 0 | 0 | 0 | 0% | 00:00:00 |
| TOTAL: 5 | 1977 | 974417 | 337816 | 471273 | 165328 | 34% | 145:55:20 | |
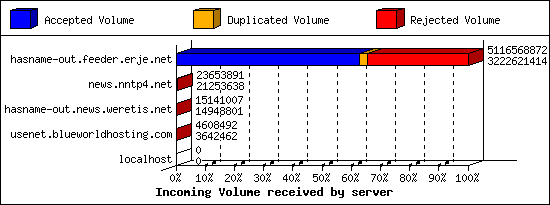
Incoming Volume (INN):
| Server | AcceptVol | DupVol | RejVol | TotalVol | %Acc | Vol/Art | |
|---|---|---|---|---|---|---|---|
| 1 | hasname-out.feeder.erje.net | 3.0 GB | 121.7 MB | 1.6 GB | 4.8 GB | 62% | 10.1 KB |
| 2 | news.nntp4.net | 20.3 MB | 17.5 KB | 2.3 MB | 22.6 MB | 89% | 10.8 KB |
| 3 | hasname-out.news.weretis.net | 14.3 MB | 78.2 KB | 109.5 KB | 14.4 MB | 98% | 2.2 KB |
| 4 | usenet.blueworldhosting.com | 3.5 MB | 0.0 KB | 943.4 KB | 4.4 MB | 79% | 2.5 KB |
| 5 | localhost | 0.0 KB | 0.0 KB | 0.0 KB | 0.0 KB | 0% | 0 |
| TOTAL: 5 | 3.0 GB | 121.8 MB | 1.6 GB | 4.8 GB | 63% | 10.0 KB | |
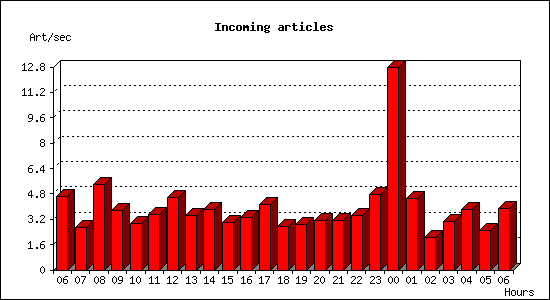
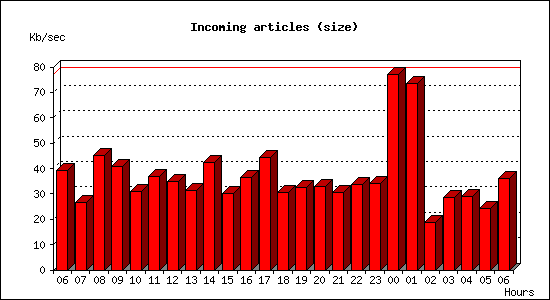
Incoming articles:
| Date | Articles | %Arts | Art/sec | Size | %Size | KB/sec |
|---|---|---|---|---|---|---|
| Oct 23 06:01:01 - 06:59:59 | 16324 | 4.8% | 4.61 | 136.1 MB | 4.4% | 39.38 |
| Oct 23 07:00:00 - 07:59:59 | 9547 | 2.8% | 2.65 | 93.9 MB | 3.0% | 26.70 |
| Oct 23 08:00:00 - 08:59:59 | 19388 | 5.7% | 5.39 | 159.1 MB | 5.1% | 45.26 |
| Oct 23 09:00:00 - 09:59:59 | 13506 | 4.0% | 3.75 | 143.6 MB | 4.6% | 40.84 |
| Oct 23 10:00:00 - 10:59:59 | 10554 | 3.1% | 2.93 | 108.5 MB | 3.5% | 30.85 |
| Oct 23 11:00:00 - 11:59:59 | 12629 | 3.7% | 3.51 | 129.0 MB | 4.1% | 36.68 |
| Oct 23 12:00:00 - 12:59:59 | 16546 | 4.9% | 4.60 | 122.2 MB | 3.9% | 34.77 |
| Oct 23 13:00:00 - 13:59:59 | 12458 | 3.7% | 3.46 | 110.4 MB | 3.5% | 31.42 |
| Oct 23 14:00:00 - 14:59:59 | 13695 | 4.1% | 3.80 | 149.2 MB | 4.8% | 42.44 |
| Oct 23 15:00:00 - 15:59:59 | 10700 | 3.2% | 2.97 | 106.4 MB | 3.4% | 30.25 |
| Oct 23 16:00:00 - 16:59:59 | 11876 | 3.5% | 3.30 | 128.1 MB | 4.1% | 36.45 |
| Oct 23 17:00:00 - 17:59:59 | 14904 | 4.4% | 4.14 | 156.4 MB | 5.0% | 44.48 |
| Oct 23 18:00:00 - 18:59:59 | 9857 | 2.9% | 2.74 | 107.6 MB | 3.5% | 30.60 |
| Oct 23 19:00:00 - 19:59:59 | 10246 | 3.0% | 2.85 | 114.7 MB | 3.7% | 32.63 |
| Oct 23 20:00:00 - 20:59:59 | 11225 | 3.3% | 3.12 | 116.3 MB | 3.7% | 33.08 |
| Oct 23 21:00:00 - 21:59:59 | 11235 | 3.3% | 3.12 | 107.6 MB | 3.5% | 30.59 |
| Oct 23 22:00:00 - 22:59:59 | 12368 | 3.7% | 3.44 | 118.3 MB | 3.8% | 33.64 |
| Oct 23 23:00:00 - 23:59:59 | 17244 | 5.1% | 4.79 | 120.3 MB | 3.9% | 34.21 |
| Oct 24 00:00:00 - 00:59:59 | 45876 | 13.6% | 12.74 | 271.5 MB | 8.7% | 77.23 |
| Oct 24 01:00:00 - 01:59:59 | 16340 | 4.8% | 4.54 | 257.8 MB | 8.3% | 73.34 |
| Oct 24 02:00:00 - 02:59:59 | 7364 | 2.2% | 2.05 | 66.1 MB | 2.1% | 18.80 |
| Oct 24 03:00:00 - 03:59:59 | 11051 | 3.3% | 3.07 | 100.7 MB | 3.2% | 28.66 |
| Oct 24 04:00:00 - 04:59:59 | 13750 | 4.1% | 3.82 | 101.8 MB | 3.3% | 28.97 |
| Oct 24 05:00:00 - 05:59:59 | 8974 | 2.7% | 2.49 | 84.6 MB | 2.7% | 24.06 |
| Oct 24 06:00:00 - 06:01:01 | 237 | 0.1% | 3.89 | 2.1 MB | 0.1% | 35.91 |
| TOTAL: 24:00:00 | 337894 | 100.0% | 3.91 | 3.0 GB | 100.0% | 36.89 |
CNFS buffer status:
| Buffer | Class | Size | Used | %Used | Cycles | KB/sec | Days |
|---|---|---|---|---|---|---|---|
| C1 | DEFAULT | 10.0 GB | 8.4 GB | 84.0% | 91 | 45.06 | 2.69 |
| TOTAL: 1 | - | 10.0 GB | 8.4 GB | 84.0% | 91 | 45.06 | - |
Sites sending bad articles:
| Server | Total | Group | Dist | Duplic | Unapp | TooOld | Site | Line | Other | |
|---|---|---|---|---|---|---|---|---|---|---|
| 1 | hasname-out.feeder.erje.net | 164900 | 149036 | 0 | 11342 | 1 | 0 | 0 | 0 | 4521 |
| 2 | news.nntp4.net | 321 | 278 | 0 | 4 | 0 | 0 | 0 | 0 | 39 |
| 3 | usenet.blueworldhosting.com | 188 | 149 | 0 | 0 | 0 | 0 | 0 | 0 | 39 |
| 4 | hasname-out.news.weretis.net | 116 | 54 | 0 | 20 | 0 | 0 | 0 | 0 | 42 |
| TOTAL: 4 | 165525 | 149517 | 0 | 11366 | 1 | 0 | 0 | 0 | 4641 | |
Unwanted newsgroups [Top 20]:
| Newsgroup | Count |
|---|---|
| alt.binaries.friends | 82384 |
| alt.binaries.encrypted | 5845 |
| alt.binaries.pwp | 2310 |
| alt.binaries.font | 2207 |
| alt.binaries.ath | 2114 |
| alt.binaries.amazing | 1582 |
| alt.binaries.ucc | 1557 |
| alt.binaries.ninja.splinter | 1508 |
| alt.binaries.noprobs | 1474 |
| alt.binaries.wtfnzb.lima | 1325 |
| alt.binaries.wtfnzb.kilo | 1319 |
| alt.binaries.wtfnzb.juliet | 1318 |
| alt.binaries.wtfnzb.charlie | 1302 |
| alt.binaries.wtfnzb.hotel | 1300 |
| alt.binaries.wtfnzb.alpha | 1295 |
| alt.binaries.wtfnzb.beta | 1293 |
| alt.binaries.wtfnzb.foxtrot | 1292 |
| alt.binaries.wtfnzb.echo | 1289 |
| alt.binaries.wtfnzb.india | 1276 |
| alt.binaries.wtfnzb.golf | 1261 |
| TOTAL: 220 | 149517 |
Supposedly-moderated groups with unmoderated postings [Top 20]:
| Groups | Count |
|---|---|
| alt.binaries.sounds.mp3.jazz.vocals | 1 |
| TOTAL: 1 | 1 |
INND no permission servers:
| System | Conn |
|---|---|
| 103.193.138.76 | 24 |
| 147.185.133.45 | 3 |
| 167.94.146.50 | 2 |
| 35.203.210.59 | 2 |
| 85.208.84.72 | 1 |
| TOTAL: 5 | 32 |
Miscellaneous innd statistics [Top 10]:
| Event | Server | Number |
|---|---|---|
| Bad Message-ID's offered | ||
| hasname-out.feeder.erje.net | 4 | |
| TOTAL: 1 | 4 | |
| Including strange strings | ||
| hasname-out.news.weretis.net | 42 | |
| news.nntp4.net | 39 | |
| usenet.blueworldhosting.com | 37 | |
| hasname-out.feeder.erje.net | 6 | |
| TOTAL: 4 | 124 | |
| No colon-space in header field | ||
| hasname-out.feeder.erje.net | 4515 | |
| usenet.blueworldhosting.com | 2 | |
| TOTAL: 2 | 4517 | |
| TOTAL: 3 | 4645 | |
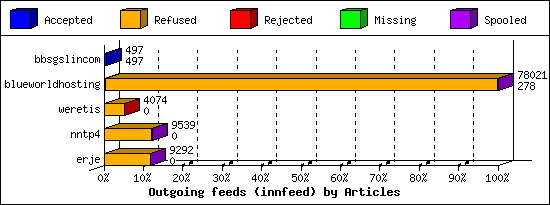
Outgoing Feeds (innfeed) by Articles:
| Server | Offered | Taken | Refused | Reject | Miss | Spool | %Took | Elapsed | |
|---|---|---|---|---|---|---|---|---|---|
| 1 | bbsgslincom | 497 | 497 | 0 | 0 | 0 | 0 | 100% | 21:34:46 |
| 2 | blueworldhosting | 79376 | 278 | 77698 | 0 | 0 | 45 | 0% | 23:59:55 |
| 3 | nntp4 | 9493 | 0 | 9484 | 0 | 0 | 55 | 0% | 23:57:26 |
| 4 | erje | 9295 | 0 | 9259 | 3 | 0 | 30 | 0% | 23:59:28 |
| 5 | weretis | 4083 | 0 | 3965 | 109 | 0 | 0 | 0% | 23:56:29 |
| TOTAL: 5 | 102744 | 775 | 100406 | 112 | 0 | 130 | 0% | 117:28:04 | |
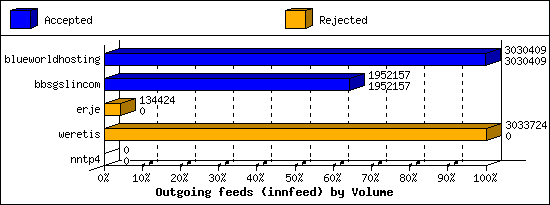
Outgoing Feeds (innfeed) by Volume:
| Server | AcceptVol | RejectVol | TotalVol | Volume/sec | Vol/Art | Elapsed | |
|---|---|---|---|---|---|---|---|
| 1 | blueworldhosting | 2.9 MB | 0.0 KB | 2.9 MB | 0.0 KB/s | 10.6 KB | 23:59:55 |
| 2 | bbsgslincom | 1.9 MB | 0.0 KB | 1.9 MB | 0.0 KB/s | 3.8 KB | 21:34:46 |
| 3 | erje | 0.0 KB | 131.3 KB | 131.3 KB | 0.0 KB/s | 43.8 KB | 23:59:28 |
| 4 | nntp4 | 0.0 KB | 0.0 KB | 0.0 KB | 0.0 KB/s | 0 | 23:57:26 |
| 5 | weretis | 0.0 KB | 2.9 MB | 2.9 MB | 0.0 KB/s | 27.2 KB | 23:56:29 |
| TOTAL: 5 | 4.8 MB | 3.0 MB | 7.8 MB | 0.0 KB/s | 9.0 KB | 117:28:04 | |
NNRP total resource statistics [Top 20]:
| System | User(ms) | System(ms) | Idle(ms) | Elapsed |
|---|---|---|---|---|
| 165.154.253.252 | 0.002 | 0.003 | 0.000 | 00:00:02 |
| hahn.probe.onyphe.net | 0.000 | 0.004 | 0.000 | 00:00:01 |
| kathleen.probe.onyphe.net | 0.000 | 0.004 | 0.000 | 00:00:00 |
| o67.scanner.modat.io | 0.002 | 0.003 | 0.000 | 00:00:00 |
| vivacious.monitoring.internet-measurement.com | 0.000 | 0.004 | 0.000 | 00:00:00 |
| 178.159.37.112 | 0.002 | 0.008 | 0.000 | 00:00:00 |
| 199.45.154.119 | 0.005 | 0.009 | 0.000 | 00:00:00 |
| 167.94.146.59 | 0.003 | 0.009 | 0.000 | 00:00:00 |
| azpdwsggbryd.stretchoid.com | 0.004 | 0.004 | 0.000 | 00:00:00 |
| 198.235.24.105 | 0.001 | 0.003 | 0.000 | 00:00:00 |
| 198.235.24.112 | 0.002 | 0.002 | 0.000 | 00:00:00 |
| TOTAL: 11 | 0.021 | 0.053 | 0.000 | 00:00:06 |
NNRP no permission clients [Top 20]:
| System | Conn |
|---|---|
| 167.94.146.59 | 3 |
| 199.45.154.119 | 3 |
| 178.159.37.112 | 2 |
| azpdwsggbryd.stretchoid.com | 2 |
| 165.154.253.252 | 1 |
| 198.235.24.105 | 1 |
| 198.235.24.112 | 1 |
| hahn.probe.onyphe.net | 1 |
| kathleen.probe.onyphe.net | 1 |
| o67.scanner.modat.io | 1 |
| vivacious.monitoring.internet-measurement.com | 1 |
| TOTAL: 11 | 17 |