Unknown entries from news log file:
First 19 / 19 lines (100.0%)
Log entries by program:
| Program name | Lines | %Lines | Size | %Size |
|---|---|---|---|---|
| inn | 515658 | 94.8% | 64.9 MB | 94.8% |
| innfeed | 20759 | 3.8% | 2.3 MB | 3.4% |
| innd | 7138 | 1.3% | 1.2 MB | 1.7% |
| cnfsstat | 144 | 0.0% | 24.1 KB | 0.0% |
| nnrpd | 35 | 0.0% | 4.1 KB | 0.0% |
| thermald | 18 | 0.0% | 1.7 KB | 0.0% |
| controlchan | 2 | 0.0% | 0.2 KB | 0.0% |
| overchan | 1 | 0.0% | 0.1 KB | 0.0% |
| TOTAL: 8 | 543755 | 100.0% | 68.4 MB | 100.0% |
History cache:
| Reason | Count | %Count |
|---|---|---|
| Negative hits | 802776 | 43.8% |
| Positive hits | 520258 | 28.4% |
| Do not exist | 501031 | 27.3% |
| Cache misses | 8483 | 0.5% |
| TOTAL: 4 | 1832548 | 100.0% |
INND timer:
| Code region | Time | Pct | Invoked | Min(ms) | Avg(ms) | Max(ms) |
|---|---|---|---|---|---|---|
| article cancel | 00:00:00.004 | 0.0% | 31 | 0.000 | 0.129 | 2.000 |
| article cleanup | 00:00:05.008 | 0.0% | 510962 | 0.005 | 0.010 | 0.018 |
| article logging | 00:00:19.179 | 0.0% | 511047 | 0.016 | 0.038 | 0.049 |
| article parse | 00:00:26.518 | 0.0% | 1378633 | 0.006 | 0.019 | 0.026 |
| article write | 00:00:23.825 | 0.0% | 277177 | 0.051 | 0.086 | 0.128 |
| artlog/artparse | 00:00:00.024 | 0.0% | 415 | 0.000 | 0.058 | 1.000 |
| data move | 00:00:10.915 | 0.0% | 1423112 | 0.001 | 0.008 | 0.014 |
| hisgrep/artcncl | 00:00:00.001 | 0.0% | 31 | 0.000 | 0.032 | 1.000 |
| history grep | 00:00:00.000 | 0.0% | 0 | 0.000 | 0.000 | 0.000 |
| history lookup | 00:00:26.410 | 0.0% | 1834509 | 0.002 | 0.014 | 0.147 |
| history sync | 00:00:00.015 | 0.0% | 300 | 0.000 | 0.050 | 1.000 |
| history write | 00:00:28.105 | 0.0% | 500522 | 0.027 | 0.056 | 0.079 |
| idle | 23:40:50.964 | 99.3% | 1128647 | 36.186 | 75.534 | 165.596 |
| nntp read | 00:00:47.306 | 0.1% | 1129946 | 0.018 | 0.042 | 0.059 |
| overview write | 00:00:01.532 | 0.0% | 277177 | 0.000 | 0.006 | 0.011 |
| perl filter | 00:00:23.260 | 0.0% | 498974 | 0.028 | 0.047 | 0.074 |
| python filter | 00:00:23.444 | 0.0% | 498974 | 0.024 | 0.047 | 0.066 |
| site send | 00:00:10.314 | 0.0% | 615999 | 0.007 | 0.017 | 0.153 |
| TOTAL: 23:50:22.174 | 23:44:56.824 | 99.6% | - | - | - | - |
INNfeed timer:
| Code region | Time | Pct | Invoked | Min(ms) | Avg(ms) | Max(ms) |
|---|---|---|---|---|---|---|
| article new | 00:00:00.221 | 0.0% | 64438 | 0.000 | 0.003 | 0.014 |
| article prepare | 00:00:00.000 | 0.0% | 2489 | 0.000 | 0.000 | 0.000 |
| article read | 00:00:00.078 | 0.0% | 700 | 0.000 | 0.111 | 1.000 |
| backlog stats | 00:00:00.201 | 0.0% | 213347 | 0.000 | 0.001 | 0.004 |
| callbacks | 00:00:00.000 | 0.0% | 0 | 0.000 | 0.000 | 0.000 |
| data read | 00:00:03.350 | 0.0% | 131741 | 0.008 | 0.025 | 0.050 |
| data write | 00:00:03.360 | 0.0% | 84255 | 0.015 | 0.040 | 0.076 |
| idle | 23:46:29.880 | 100.0% | 213347 | 90.374 | 401.177 | 1125.687 |
| status file | 00:00:06.410 | 0.0% | 8397 | 0.525 | 0.763 | 4.614 |
| TOTAL: 23:46:58.279 | 23:46:43.500 | 100.0% | - | - | - | - |
nnrpd timer:
| Code region | Time | Pct | Invoked | Min(ms) | Avg(ms) | Max(ms) |
|---|---|---|---|---|---|---|
| idle | 00:00:00.000 | 0.0% | 0 | 0.000 | 0.000 | 0.000 |
| newnews | 00:00:00.000 | 0.0% | 0 | 0.000 | 0.000 | 0.000 |
| nntpwrite | 00:00:00.002 | 0.1% | 8 | 0.000 | 0.250 | 1.000 |
| TOTAL: 00:00:01.750 | 00:00:00.002 | 0.1% | - | - | - | - |
Control commands to INND:
| Command | Number |
|---|---|
| flush | 5 |
| flushlogs | 2 |
| go | 2 |
| logmode | 2 |
| lowmark | 1 |
| mode | 147 |
| name | 2 |
| pause | 2 |
| paused | 2 |
| reload | 48 |
| reserve | 2 |
| TOTAL: 11 | 215 |
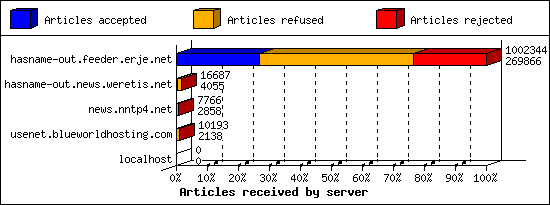
Incoming Feeds (INN):
| Server | Connects | Offered | Taken | Refused | Reject | %Accpt | Elapsed | |
|---|---|---|---|---|---|---|---|---|
| 1 | hasname-out.feeder.erje.net | 578 | 1002344 | 269866 | 496593 | 235885 | 26% | 49:35:41 |
| 2 | hasname-out.news.weretis.net | 4 | 16687 | 4055 | 12594 | 38 | 24% | 46:21:03 |
| 3 | news.nntp4.net | 3 | 7766 | 2858 | 4659 | 249 | 36% | 23:27:35 |
| 4 | usenet.blueworldhosting.com | 289 | 10193 | 2138 | 7932 | 123 | 20% | 23:38:03 |
| 5 | localhost | 1 | 0 | 0 | 0 | 0 | 0% | 00:00:00 |
| TOTAL: 5 | 875 | 1036990 | 278917 | 521778 | 236295 | 26% | 143:02:22 | |
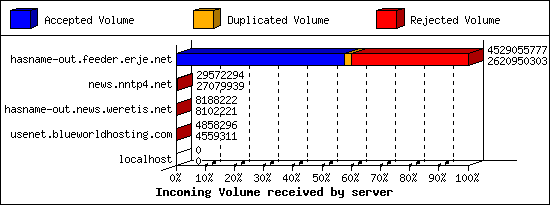
Incoming Volume (INN):
| Server | AcceptVol | DupVol | RejVol | TotalVol | %Acc | Vol/Art | |
|---|---|---|---|---|---|---|---|
| 1 | hasname-out.feeder.erje.net | 2.4 GB | 96.3 MB | 1.7 GB | 4.2 GB | 57% | 8.7 KB |
| 2 | news.nntp4.net | 25.8 MB | 20.8 KB | 2.4 MB | 28.2 MB | 91% | 9.3 KB |
| 3 | hasname-out.news.weretis.net | 7.7 MB | 30.1 KB | 53.8 KB | 7.8 MB | 98% | 2.0 KB |
| 4 | usenet.blueworldhosting.com | 4.3 MB | 0.0 KB | 292.0 KB | 4.6 MB | 93% | 2.1 KB |
| 5 | localhost | 0.0 KB | 0.0 KB | 0.0 KB | 0.0 KB | 0% | 0 |
| TOTAL: 5 | 2.5 GB | 96.3 MB | 1.7 GB | 4.3 GB | 58% | 8.7 KB | |
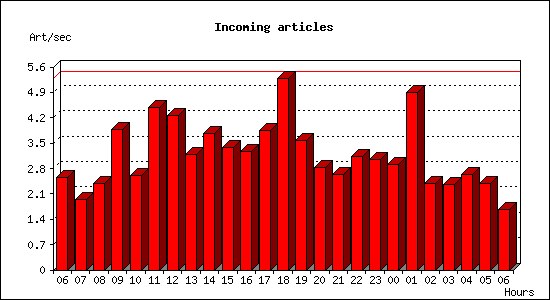
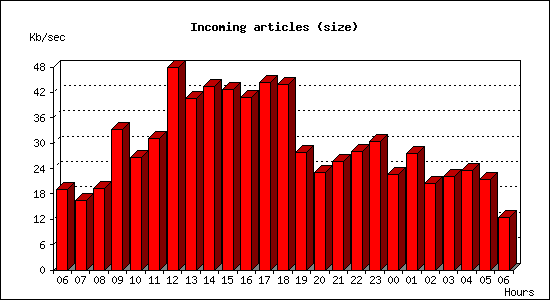
Incoming articles:
| Date | Articles | %Arts | Art/sec | Size | %Size | KB/sec |
|---|---|---|---|---|---|---|
| Jan 16 06:01:01 - 06:59:59 | 9025 | 3.2% | 2.55 | 65.8 MB | 2.6% | 19.05 |
| Jan 16 07:00:00 - 07:59:59 | 6984 | 2.5% | 1.94 | 58.0 MB | 2.3% | 16.49 |
| Jan 16 08:00:00 - 08:59:59 | 8594 | 3.1% | 2.39 | 67.9 MB | 2.7% | 19.31 |
| Jan 16 09:00:00 - 09:59:59 | 13981 | 5.0% | 3.88 | 117.2 MB | 4.6% | 33.34 |
| Jan 16 10:00:00 - 10:59:59 | 9420 | 3.4% | 2.62 | 93.6 MB | 3.7% | 26.61 |
| Jan 16 11:00:00 - 11:59:59 | 16113 | 5.8% | 4.48 | 109.2 MB | 4.3% | 31.06 |
| Jan 16 12:00:00 - 12:59:59 | 15347 | 5.5% | 4.26 | 168.6 MB | 6.6% | 47.96 |
| Jan 16 13:00:00 - 13:59:59 | 11431 | 4.1% | 3.18 | 142.6 MB | 5.6% | 40.57 |
| Jan 16 14:00:00 - 14:59:59 | 13529 | 4.8% | 3.76 | 152.7 MB | 6.0% | 43.44 |
| Jan 16 15:00:00 - 15:59:59 | 12173 | 4.4% | 3.38 | 149.8 MB | 5.9% | 42.61 |
| Jan 16 16:00:00 - 16:59:59 | 11757 | 4.2% | 3.27 | 143.8 MB | 5.7% | 40.90 |
| Jan 16 17:00:00 - 17:59:59 | 13893 | 5.0% | 3.86 | 155.8 MB | 6.1% | 44.30 |
| Jan 16 18:00:00 - 18:59:59 | 19014 | 6.8% | 5.28 | 154.1 MB | 6.1% | 43.85 |
| Jan 16 19:00:00 - 19:59:59 | 12885 | 4.6% | 3.58 | 97.5 MB | 3.8% | 27.73 |
| Jan 16 20:00:00 - 20:59:59 | 10157 | 3.6% | 2.82 | 81.3 MB | 3.2% | 23.13 |
| Jan 16 21:00:00 - 21:59:59 | 9446 | 3.4% | 2.62 | 90.2 MB | 3.6% | 25.65 |
| Jan 16 22:00:00 - 22:59:59 | 11266 | 4.0% | 3.13 | 98.6 MB | 3.9% | 28.05 |
| Jan 16 23:00:00 - 23:59:59 | 10926 | 3.9% | 3.04 | 107.1 MB | 4.2% | 30.47 |
| Jan 17 00:00:00 - 00:59:59 | 10489 | 3.8% | 2.91 | 79.1 MB | 3.1% | 22.51 |
| Jan 17 01:00:00 - 01:59:59 | 17586 | 6.3% | 4.88 | 96.8 MB | 3.8% | 27.53 |
| Jan 17 02:00:00 - 02:59:59 | 8600 | 3.1% | 2.39 | 71.8 MB | 2.8% | 20.41 |
| Jan 17 03:00:00 - 03:59:59 | 8497 | 3.0% | 2.36 | 78.1 MB | 3.1% | 22.22 |
| Jan 17 04:00:00 - 04:59:59 | 9484 | 3.4% | 2.63 | 82.7 MB | 3.3% | 23.52 |
| Jan 17 05:00:00 - 05:59:59 | 8622 | 3.1% | 2.40 | 75.2 MB | 3.0% | 21.39 |
| Jan 17 06:00:00 - 06:01:02 | 104 | 0.0% | 1.68 | 774.1 KB | 0.0% | 12.48 |
| TOTAL: 24:00:01 | 279323 | 100.0% | 3.23 | 2.5 GB | 100.0% | 30.08 |
CNFS buffer status:
| Buffer | Class | Size | Used | %Used | Cycles | KB/sec | Days |
|---|---|---|---|---|---|---|---|
| C1 | DEFAULT | 10.0 GB | 8.6 GB | 85.9% | 117 | 37.16 | 3.27 |
| TOTAL: 1 | - | 10.0 GB | 8.6 GB | 85.9% | 117 | 37.16 | - |
Sites sending bad articles:
| Server | Total | Group | Dist | Duplic | Unapp | TooOld | Site | Line | Other | |
|---|---|---|---|---|---|---|---|---|---|---|
| 1 | hasname-out.feeder.erje.net | 235873 | 223368 | 0 | 10914 | 0 | 1163 | 0 | 0 | 428 |
| 2 | news.nntp4.net | 249 | 231 | 0 | 2 | 0 | 0 | 0 | 0 | 16 |
| 3 | usenet.blueworldhosting.com | 162 | 119 | 0 | 0 | 0 | 0 | 0 | 0 | 43 |
| 4 | hasname-out.news.weretis.net | 51 | 23 | 0 | 14 | 0 | 0 | 0 | 0 | 14 |
| TOTAL: 4 | 236335 | 223741 | 0 | 10930 | 0 | 1163 | 0 | 0 | 501 | |
Unwanted newsgroups [Top 20]:
| Newsgroup | Count |
|---|---|
| alt.binaries.friends | 142732 |
| alt.binaries.encrypted | 4896 |
| alt.binaries.amazing | 2949 |
| alt.binaries.u-4all | 2714 |
| alt.binaries.wtfnzb.kilo | 2412 |
| alt.binaries.wtfnzb.echo | 2392 |
| alt.binaries.wtfnzb.lima | 2383 |
| alt.binaries.wtfnzb.hotel | 2351 |
| alt.binaries.wtfnzb.alpha | 2350 |
| alt.binaries.wtfnzb.beta | 2348 |
| alt.binaries.wtfnzb.juliet | 2340 |
| alt.binaries.wtfnzb.golf | 2317 |
| alt.binaries.wtfnzb.bravo | 2316 |
| alt.binaries.wtfnzb.india | 2313 |
| alt.binaries.wtfnzb.foxtrot | 2291 |
| alt.binaries.wtfnzb.mike | 2291 |
| alt.binaries.wtfnzb.novemeber | 2290 |
| alt.binaries.wtfnzb.charlie | 2288 |
| alt.binaries.wtfnzb.delta | 2247 |
| alt.binaries.font | 2151 |
| TOTAL: 204 | 223741 |
INND no permission servers:
| System | Conn |
|---|---|
| 103.193.138.76 | 30 |
| 54.36.109.115 | 30 |
| 147.185.133.247 | 2 |
| 162.216.149.63 | 2 |
| 91.231.89.150 | 1 |
| 91.231.89.239 | 1 |
| TOTAL: 6 | 66 |
Miscellaneous innd statistics [Top 10]:
| Event | Server | Number |
|---|---|---|
| Bad Message-ID's offered | ||
| hasname-out.feeder.erje.net | 2 | |
| TOTAL: 1 | 2 | |
| Including strange strings | ||
| usenet.blueworldhosting.com | 39 | |
| hasname-out.feeder.erje.net | 17 | |
| news.nntp4.net | 16 | |
| hasname-out.news.weretis.net | 14 | |
| TOTAL: 4 | 86 | |
| No colon-space in header field | ||
| hasname-out.feeder.erje.net | 411 | |
| usenet.blueworldhosting.com | 4 | |
| TOTAL: 2 | 415 | |
| TOTAL: 3 | 503 | |
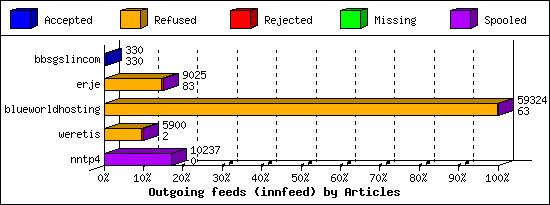
Outgoing Feeds (innfeed) by Articles:
| Server | Offered | Taken | Refused | Reject | Miss | Spool | %Took | Elapsed | |
|---|---|---|---|---|---|---|---|---|---|
| 1 | bbsgslincom | 330 | 330 | 0 | 0 | 0 | 0 | 100% | 18:56:51 |
| 2 | erje | 9263 | 83 | 8645 | 223 | 0 | 74 | 0% | 23:55:41 |
| 3 | blueworldhosting | 60905 | 63 | 59148 | 0 | 0 | 113 | 0% | 23:55:41 |
| 4 | weretis | 5895 | 2 | 5712 | 169 | 0 | 17 | 0% | 23:56:12 |
| 5 | nntp4 | 2760 | 0 | 0 | 0 | 0 | 10237 | 0% | 23:56:39 |
| TOTAL: 5 | 79153 | 478 | 73505 | 392 | 0 | 10441 | 0% | 114:41:04 | |
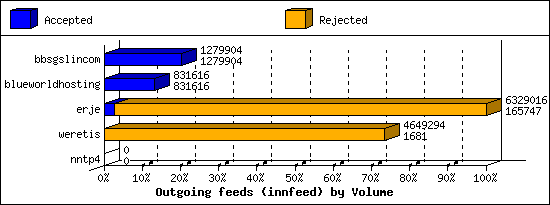
Outgoing Feeds (innfeed) by Volume:
| Server | AcceptVol | RejectVol | TotalVol | Volume/sec | Vol/Art | Elapsed | |
|---|---|---|---|---|---|---|---|
| 1 | bbsgslincom | 1.2 MB | 0.0 KB | 1.2 MB | 0.0 KB/s | 3.8 KB | 18:56:51 |
| 2 | blueworldhosting | 812.1 KB | 0.0 KB | 812.1 KB | 0.0 KB/s | 12.9 KB | 23:55:41 |
| 3 | erje | 161.9 KB | 5.9 MB | 6.0 MB | 0.1 KB/s | 20.2 KB | 23:55:41 |
| 4 | weretis | 1.6 KB | 4.4 MB | 4.4 MB | 0.1 KB/s | 26.6 KB | 23:56:12 |
| 5 | nntp4 | 0.0 KB | 0.0 KB | 0.0 KB | 0.0 KB/s | 0 | 23:56:39 |
| TOTAL: 5 | 2.2 MB | 10.3 MB | 12.5 MB | 0.0 KB/s | 14.7 KB | 114:41:04 | |
NNRP total resource statistics [Top 20]:
| System | User(ms) | System(ms) | Idle(ms) | Elapsed |
|---|---|---|---|---|
| shelby.probe.onyphe.net | 0.001 | 0.003 | 0.000 | 00:00:00 |
| santana.probe.onyphe.net | 0.000 | 0.005 | 0.000 | 00:00:00 |
| 195.178.110.25 | 0.000 | 0.003 | 0.000 | 00:00:00 |
| scanner-207.ch1.censys-scanner.com | 0.000 | 0.002 | 0.000 | 00:00:00 |
| azpdssgoqznt.stretchoid.com | 0.002 | 0.007 | 0.000 | 00:00:00 |
| 198.235.24.96 | 0.002 | 0.002 | 0.000 | 00:00:00 |
| 198.235.24.101 | 0.000 | 0.004 | 0.000 | 00:00:00 |
| TOTAL: 7 | 0.005 | 0.026 | 0.000 | 00:00:01 |
NNRP no permission clients [Top 20]:
| System | Conn |
|---|---|
| azpdssgoqznt.stretchoid.com | 2 |
| 195.178.110.25 | 1 |
| 198.235.24.101 | 1 |
| 198.235.24.96 | 1 |
| santana.probe.onyphe.net | 1 |
| scanner-207.ch1.censys-scanner.com | 1 |
| shelby.probe.onyphe.net | 1 |
| TOTAL: 7 | 8 |