Unknown entries from news log file:
First 18 / 18 lines (100.0%)
Log entries by program:
| Program name | Lines | %Lines | Size | %Size |
|---|---|---|---|---|
| inn | 391209 | 84.7% | 50.5 MB | 83.8% |
| innd | 49772 | 10.8% | 7.5 MB | 12.4% |
| innfeed | 20838 | 4.5% | 2.3 MB | 3.8% |
| cnfsstat | 144 | 0.0% | 24.6 KB | 0.0% |
| nnrpd | 34 | 0.0% | 4.0 KB | 0.0% |
| thermald | 17 | 0.0% | 1.7 KB | 0.0% |
| controlchan | 2 | 0.0% | 0.2 KB | 0.0% |
| overchan | 2 | 0.0% | 0.2 KB | 0.0% |
| TOTAL: 8 | 462018 | 100.0% | 60.3 MB | 100.0% |
History cache:
| Reason | Count | %Count |
|---|---|---|
| Negative hits | 634299 | 44.5% |
| Positive hits | 395081 | 27.7% |
| Do not exist | 381117 | 26.8% |
| Cache misses | 13672 | 1.0% |
| TOTAL: 4 | 1424169 | 100.0% |
INND timer:
| Code region | Time | Pct | Invoked | Min(ms) | Avg(ms) | Max(ms) |
|---|---|---|---|---|---|---|
| article cancel | 00:00:00.006 | 0.0% | 44 | 0.000 | 0.136 | 1.000 |
| article cleanup | 00:00:04.201 | 0.0% | 389085 | 0.005 | 0.011 | 0.019 |
| article logging | 00:00:15.985 | 0.0% | 389165 | 0.016 | 0.041 | 0.061 |
| article parse | 00:00:24.199 | 0.0% | 1170442 | 0.011 | 0.021 | 0.029 |
| article write | 00:00:18.503 | 0.0% | 202907 | 0.037 | 0.091 | 0.125 |
| artlog/artparse | 00:00:00.023 | 0.0% | 419 | 0.000 | 0.055 | 1.000 |
| data move | 00:00:11.830 | 0.0% | 1306927 | 0.001 | 0.009 | 0.014 |
| hisgrep/artcncl | 00:00:00.000 | 0.0% | 44 | 0.000 | 0.000 | 0.000 |
| history grep | 00:00:00.000 | 0.0% | 0 | 0.000 | 0.000 | 0.000 |
| history lookup | 00:00:29.264 | 0.0% | 1426435 | 0.002 | 0.021 | 0.539 |
| history sync | 00:00:00.033 | 0.0% | 299 | 0.000 | 0.110 | 7.500 |
| history write | 00:00:24.570 | 0.0% | 381027 | 0.041 | 0.064 | 0.509 |
| idle | 23:40:39.971 | 99.3% | 1041976 | 16.000 | 81.806 | 160.980 |
| nntp read | 00:00:45.753 | 0.1% | 1043327 | 0.029 | 0.044 | 0.059 |
| overview write | 00:00:01.098 | 0.0% | 202907 | 0.001 | 0.005 | 0.012 |
| perl filter | 00:00:19.330 | 0.0% | 374423 | 0.024 | 0.052 | 0.072 |
| python filter | 00:00:19.579 | 0.0% | 374423 | 0.024 | 0.052 | 0.076 |
| site send | 00:00:08.272 | 0.0% | 493135 | 0.010 | 0.017 | 0.109 |
| TOTAL: 23:50:21.353 | 23:44:22.617 | 99.6% | - | - | - | - |
INNfeed timer:
| Code region | Time | Pct | Invoked | Min(ms) | Avg(ms) | Max(ms) |
|---|---|---|---|---|---|---|
| article new | 00:00:00.341 | 0.0% | 89581 | 0.000 | 0.004 | 0.011 |
| article prepare | 00:00:00.000 | 0.0% | 565 | 0.000 | 0.000 | 0.000 |
| article read | 00:00:00.034 | 0.0% | 346 | 0.000 | 0.098 | 1.000 |
| backlog stats | 00:00:00.283 | 0.0% | 293295 | 0.000 | 0.001 | 0.004 |
| callbacks | 00:00:00.000 | 0.0% | 0 | 0.000 | 0.000 | 0.000 |
| data read | 00:00:05.090 | 0.0% | 184419 | 0.014 | 0.028 | 0.047 |
| data write | 00:00:05.183 | 0.0% | 107244 | 0.015 | 0.048 | 0.081 |
| idle | 23:41:52.237 | 100.0% | 293295 | 125.455 | 290.875 | 852.146 |
| status file | 00:00:06.229 | 0.0% | 8419 | 0.524 | 0.740 | 3.770 |
| TOTAL: 23:42:25.780 | 23:42:09.397 | 100.0% | - | - | - | - |
nnrpd timer:
| Code region | Time | Pct | Invoked | Min(ms) | Avg(ms) | Max(ms) |
|---|---|---|---|---|---|---|
| idle | 00:00:00.000 | 0.0% | 0 | 0.000 | 0.000 | 0.000 |
| newnews | 00:00:00.000 | 0.0% | 0 | 0.000 | 0.000 | 0.000 |
| nntpwrite | 00:00:00.001 | 0.1% | 8 | 0.000 | 0.125 | 1.000 |
| TOTAL: 00:00:01.733 | 00:00:00.001 | 0.1% | - | - | - | - |
Control commands to INND:
| Command | Number |
|---|---|
| flush | 5 |
| flushlogs | 2 |
| go | 2 |
| logmode | 2 |
| lowmark | 1 |
| mode | 146 |
| name | 2 |
| pause | 2 |
| paused | 2 |
| reload | 48 |
| reserve | 2 |
| TOTAL: 11 | 214 |
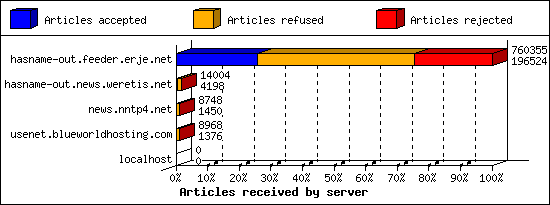
Incoming Feeds (INN):
| Server | Connects | Offered | Taken | Refused | Reject | %Accpt | Elapsed | |
|---|---|---|---|---|---|---|---|---|
| 1 | hasname-out.feeder.erje.net | 579 | 760355 | 196524 | 376857 | 186974 | 25% | 48:09:11 |
| 2 | hasname-out.news.weretis.net | 7 | 14004 | 4198 | 9783 | 23 | 29% | 43:39:58 |
| 3 | news.nntp4.net | 2 | 8748 | 1450 | 7165 | 133 | 16% | 25:00:32 |
| 4 | usenet.blueworldhosting.com | 289 | 8968 | 1376 | 7401 | 191 | 15% | 23:39:36 |
| 5 | localhost | 1 | 0 | 0 | 0 | 0 | 0% | 00:00:00 |
| TOTAL: 5 | 878 | 792075 | 203548 | 401206 | 187321 | 25% | 140:29:17 | |
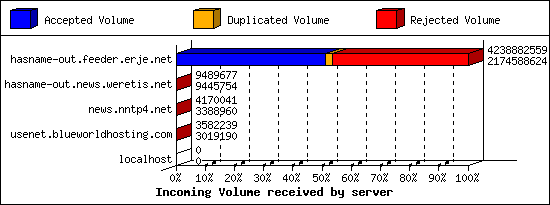
Incoming Volume (INN):
| Server | AcceptVol | DupVol | RejVol | TotalVol | %Acc | Vol/Art | |
|---|---|---|---|---|---|---|---|
| 1 | hasname-out.feeder.erje.net | 2.0 GB | 91.8 MB | 1.8 GB | 3.9 GB | 51% | 10.8 KB |
| 2 | hasname-out.news.weretis.net | 9.0 MB | 15.2 KB | 27.7 KB | 9.1 MB | 99% | 2.2 KB |
| 3 | news.nntp4.net | 3.2 MB | 12.8 KB | 750.0 KB | 4.0 MB | 81% | 2.6 KB |
| 4 | usenet.blueworldhosting.com | 2.9 MB | 0.0 KB | 549.9 KB | 3.4 MB | 84% | 2.2 KB |
| 5 | localhost | 0.0 KB | 0.0 KB | 0.0 KB | 0.0 KB | 0% | 0 |
| TOTAL: 5 | 2.0 GB | 91.8 MB | 1.8 GB | 4.0 GB | 51% | 10.6 KB | |
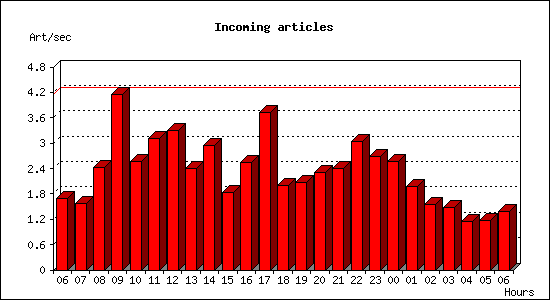
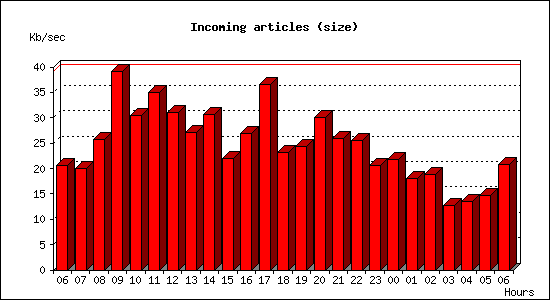
Incoming articles:
| Date | Articles | %Arts | Art/sec | Size | %Size | KB/sec |
|---|---|---|---|---|---|---|
| Feb 7 06:01:02 - 06:59:59 | 5972 | 2.9% | 1.69 | 71.4 MB | 3.4% | 20.67 |
| Feb 7 07:00:00 - 07:59:59 | 5703 | 2.8% | 1.58 | 70.1 MB | 3.4% | 19.95 |
| Feb 7 08:00:00 - 08:59:59 | 8691 | 4.3% | 2.41 | 90.4 MB | 4.3% | 25.70 |
| Feb 7 09:00:00 - 09:59:59 | 14981 | 7.4% | 4.16 | 137.6 MB | 6.6% | 39.15 |
| Feb 7 10:00:00 - 10:59:59 | 9223 | 4.5% | 2.56 | 107.3 MB | 5.1% | 30.52 |
| Feb 7 11:00:00 - 11:59:59 | 11222 | 5.5% | 3.12 | 123.2 MB | 5.9% | 35.05 |
| Feb 7 12:00:00 - 12:59:59 | 11858 | 5.8% | 3.29 | 109.4 MB | 5.2% | 31.12 |
| Feb 7 13:00:00 - 13:59:59 | 8633 | 4.2% | 2.40 | 95.5 MB | 4.6% | 27.16 |
| Feb 7 14:00:00 - 14:59:59 | 10567 | 5.2% | 2.94 | 107.4 MB | 5.1% | 30.56 |
| Feb 7 15:00:00 - 15:59:59 | 6560 | 3.2% | 1.82 | 76.9 MB | 3.7% | 21.88 |
| Feb 7 16:00:00 - 16:59:59 | 9156 | 4.5% | 2.54 | 94.5 MB | 4.5% | 26.87 |
| Feb 7 17:00:00 - 17:59:59 | 13384 | 6.6% | 3.72 | 128.5 MB | 6.2% | 36.56 |
| Feb 7 18:00:00 - 18:59:59 | 7151 | 3.5% | 1.99 | 81.2 MB | 3.9% | 23.11 |
| Feb 7 19:00:00 - 19:59:59 | 7410 | 3.6% | 2.06 | 85.8 MB | 4.1% | 24.41 |
| Feb 7 20:00:00 - 20:59:59 | 8326 | 4.1% | 2.31 | 105.8 MB | 5.1% | 30.09 |
| Feb 7 21:00:00 - 21:59:59 | 8657 | 4.3% | 2.40 | 91.1 MB | 4.4% | 25.92 |
| Feb 7 22:00:00 - 22:59:59 | 10968 | 5.4% | 3.05 | 89.7 MB | 4.3% | 25.50 |
| Feb 7 23:00:00 - 23:59:59 | 9624 | 4.7% | 2.67 | 72.4 MB | 3.5% | 20.61 |
| Feb 8 00:00:00 - 00:59:59 | 9264 | 4.5% | 2.57 | 76.7 MB | 3.7% | 21.81 |
| Feb 8 01:00:00 - 01:59:59 | 7084 | 3.5% | 1.97 | 63.2 MB | 3.0% | 17.98 |
| Feb 8 02:00:00 - 02:59:59 | 5557 | 2.7% | 1.54 | 66.1 MB | 3.2% | 18.81 |
| Feb 8 03:00:00 - 03:59:59 | 5313 | 2.6% | 1.48 | 44.6 MB | 2.1% | 12.70 |
| Feb 8 04:00:00 - 04:59:59 | 4102 | 2.0% | 1.14 | 47.4 MB | 2.3% | 13.49 |
| Feb 8 05:00:00 - 05:59:59 | 4185 | 2.1% | 1.16 | 51.5 MB | 2.5% | 14.64 |
| Feb 8 06:00:00 - 06:01:01 | 85 | 0.0% | 1.39 | 1.2 MB | 0.1% | 20.84 |
| TOTAL: 23:59:59 | 203676 | 100.0% | 2.36 | 2.0 GB | 100.0% | 24.76 |
CNFS buffer status:
| Buffer | Class | Size | Used | %Used | Cycles | KB/sec | Days |
|---|---|---|---|---|---|---|---|
| C1 | DEFAULT | 10.0 GB | 3.4 GB | 34.1% | 123 | 29.80 | 4.07 |
| TOTAL: 1 | - | 10.0 GB | 3.4 GB | 34.1% | 123 | 29.80 | - |
Sites sending bad articles:
| Server | Total | Group | Dist | Duplic | Unapp | TooOld | Site | Line | Other | |
|---|---|---|---|---|---|---|---|---|---|---|
| 1 | hasname-out.feeder.erje.net | 187133 | 171982 | 0 | 8502 | 5 | 6210 | 0 | 0 | 434 |
| 2 | usenet.blueworldhosting.com | 238 | 191 | 0 | 0 | 0 | 0 | 0 | 0 | 47 |
| 3 | news.nntp4.net | 122 | 105 | 0 | 12 | 0 | 0 | 0 | 0 | 5 |
| 4 | hasname-out.news.weretis.net | 40 | 14 | 0 | 10 | 0 | 0 | 0 | 0 | 16 |
| TOTAL: 4 | 187533 | 172292 | 0 | 8524 | 5 | 6210 | 0 | 0 | 502 | |
Unwanted newsgroups [Top 20]:
| Newsgroup | Count |
|---|---|
| alt.binaries.friends | 103519 |
| alt.binaries.font | 4134 |
| alt.binaries.amazing | 3575 |
| alt.binaries.encrypted | 3359 |
| alt.binaries.u-4all | 3206 |
| alt.binaries.ath | 2635 |
| alt.binaries.pwp | 1522 |
| alt.binaries.big | 1425 |
| alt.binaries.ghosts | 1384 |
| alt.binaries.usenetrevolution | 1346 |
| alt.binaries.town | 1342 |
| alt.binaries.u4e | 1322 |
| alt.binaries.wtfnzb.delta | 1248 |
| alt.binaries.wtfnzb.alpha | 1206 |
| alt.binaries.wtfnzb.golf | 1185 |
| alt.binaries.wtfnzb.foxtrot | 1179 |
| alt.binaries.wtfnzb.india | 1154 |
| alt.binaries.wtfnzb.hotel | 1151 |
| alt.binaries.wtfnzb.bravo | 1147 |
| alt.binaries.wtfnzb.mike | 1138 |
| TOTAL: 260 | 172292 |
Supposedly-moderated groups with unmoderated postings [Top 20]:
| Groups | Count |
|---|---|
| alt.binaries.sounds.mp3.jazz.vocals | 4 |
| uk.religion.christian | 1 |
| TOTAL: 2 | 5 |
INND no permission servers:
| System | Conn |
|---|---|
| 103.193.138.76 | 30 |
| 162.142.125.200 | 2 |
| 162.216.149.74 | 2 |
| 35.203.210.37 | 2 |
| 167.94.138.50 | 1 |
| 88.214.25.121 | 1 |
| TOTAL: 6 | 38 |
Miscellaneous innd statistics [Top 10]:
| Event | Server | Number |
|---|---|---|
| Bad Message-ID's offered | ||
| hasname-out.feeder.erje.net | 43274 | |
| TOTAL: 1 | 43274 | |
| Including strange strings | ||
| usenet.blueworldhosting.com | 47 | |
| hasname-out.news.weretis.net | 16 | |
| hasname-out.feeder.erje.net | 12 | |
| news.nntp4.net | 5 | |
| TOTAL: 4 | 80 | |
| No colon-space in header field | ||
| hasname-out.feeder.erje.net | 421 | |
| TOTAL: 1 | 421 | |
| TOTAL: 3 | 43775 | |
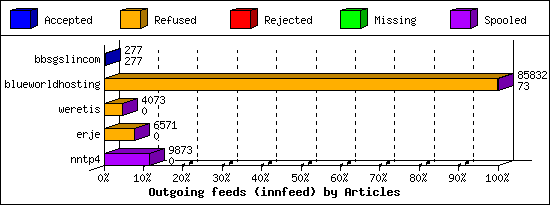
Outgoing Feeds (innfeed) by Articles:
| Server | Offered | Taken | Refused | Reject | Miss | Spool | %Took | Elapsed | |
|---|---|---|---|---|---|---|---|---|---|
| 1 | bbsgslincom | 277 | 277 | 0 | 0 | 0 | 0 | 100% | 18:47:21 |
| 2 | blueworldhosting | 88704 | 73 | 85737 | 0 | 0 | 22 | 0% | 23:56:52 |
| 3 | erje | 6562 | 0 | 6559 | 0 | 0 | 12 | 0% | 23:56:52 |
| 4 | weretis | 4064 | 0 | 4064 | 0 | 0 | 9 | 0% | 23:47:21 |
| 5 | nntp4 | 2763 | 0 | 0 | 0 | 0 | 9873 | 0% | 23:56:41 |
| TOTAL: 5 | 102370 | 350 | 96360 | 0 | 0 | 9916 | 0% | 114:25:07 | |
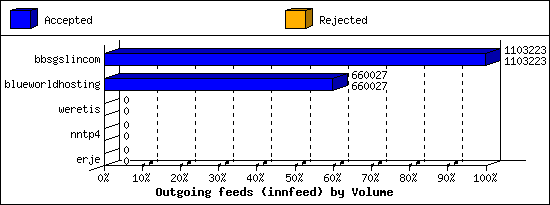
Outgoing Feeds (innfeed) by Volume:
| Server | AcceptVol | RejectVol | TotalVol | Volume/sec | Vol/Art | Elapsed | |
|---|---|---|---|---|---|---|---|
| 1 | bbsgslincom | 1.1 MB | 0.0 KB | 1.1 MB | 0.0 KB/s | 3.9 KB | 18:47:21 |
| 2 | blueworldhosting | 644.6 KB | 0.0 KB | 644.6 KB | 0.0 KB/s | 8.8 KB | 23:56:52 |
| 3 | erje | 0.0 KB | 0.0 KB | 0.0 KB | 0.0 KB/s | 0 | 23:56:52 |
| 4 | nntp4 | 0.0 KB | 0.0 KB | 0.0 KB | 0.0 KB/s | 0 | 23:56:41 |
| 5 | weretis | 0.0 KB | 0.0 KB | 0.0 KB | 0.0 KB/s | 0 | 23:47:21 |
| TOTAL: 5 | 1.7 MB | 0.0 KB | 1.7 MB | 0.0 KB/s | 4.9 KB | 114:25:07 | |
NNRP total resource statistics [Top 20]:
| System | User(ms) | System(ms) | Idle(ms) | Elapsed |
|---|---|---|---|---|
| 194.165.16.165 | 0.001 | 0.003 | 0.000 | 00:00:00 |
| 154.154.45.199.censys-scanner.com | 0.003 | 0.009 | 0.000 | 00:00:00 |
| 81-27-110-56.dk-cph1.upcloud.host | 0.001 | 0.003 | 0.000 | 00:00:00 |
| joyful.monitoring.internet-measurement.com | 0.003 | 0.001 | 0.000 | 00:00:00 |
| o027.scanner.modat.io | 0.001 | 0.001 | 0.000 | 00:00:00 |
| 198.235.24.169 | 0.001 | 0.002 | 0.000 | 00:00:00 |
| TOTAL: 6 | 0.010 | 0.019 | 0.000 | 00:00:01 |
NNRP no permission clients [Top 20]:
| System | Conn |
|---|---|
| 154.154.45.199.censys-scanner.com | 3 |
| 194.165.16.165 | 1 |
| 198.235.24.169 | 1 |
| 81-27-110-56.dk-cph1.upcloud.host | 1 |
| joyful.monitoring.internet-measurement.com | 1 |
| o027.scanner.modat.io | 1 |
| TOTAL: 6 | 8 |