Unknown entries from news log file:
First 18 / 18 lines (100.0%)
Log entries by program:
| Program name | Lines | %Lines | Size | %Size |
|---|---|---|---|---|
| inn | 504035 | 98.2% | 66.8 MB | 97.9% |
| innd | 7753 | 1.5% | 1.2 MB | 1.7% |
| innfeed | 1490 | 0.3% | 221.1 KB | 0.3% |
| cnfsstat | 145 | 0.0% | 25.8 KB | 0.0% |
| nnrpd | 45 | 0.0% | 4.7 KB | 0.0% |
| thermald | 17 | 0.0% | 1.7 KB | 0.0% |
| controlchan | 2 | 0.0% | 0.1 KB | 0.0% |
| TOTAL: 7 | 513487 | 100.0% | 68.2 MB | 100.0% |
History cache:
| Reason | Count | %Count |
|---|---|---|
| Negative hits | 514232 | 49.4% |
| Do not exist | 499278 | 48.0% |
| Positive hits | 25300 | 2.4% |
| Cache misses | 2231 | 0.2% |
| TOTAL: 4 | 1041041 | 100.0% |
INND timer:
| Code region | Time | Pct | Invoked | Min(ms) | Avg(ms) | Max(ms) |
|---|---|---|---|---|---|---|
| article cancel | 00:00:00.018 | 0.0% | 59 | 0.000 | 0.305 | 1.000 |
| article cleanup | 00:00:05.086 | 0.0% | 499614 | 0.003 | 0.010 | 0.018 |
| article logging | 00:00:18.292 | 0.0% | 499641 | 0.016 | 0.037 | 0.067 |
| article parse | 00:00:22.840 | 0.0% | 1217804 | 0.005 | 0.019 | 0.028 |
| article write | 00:00:19.784 | 0.0% | 239348 | 0.040 | 0.083 | 0.130 |
| artlog/artparse | 00:00:00.000 | 0.0% | 0 | 0.000 | 0.000 | 0.000 |
| data move | 00:00:03.287 | 0.0% | 1160094 | 0.000 | 0.003 | 0.013 |
| hisgrep/artcncl | 00:00:00.003 | 0.0% | 59 | 0.000 | 0.051 | 0.333 |
| history grep | 00:00:00.000 | 0.0% | 0 | 0.000 | 0.000 | 0.000 |
| history lookup | 00:00:33.964 | 0.0% | 1042692 | 0.002 | 0.033 | 0.346 |
| history sync | 00:00:00.019 | 0.0% | 302 | 0.000 | 0.063 | 0.500 |
| history write | 00:00:29.365 | 0.0% | 499580 | 0.035 | 0.059 | 0.111 |
| idle | 23:43:16.063 | 99.5% | 889011 | 39.586 | 96.057 | 214.189 |
| nntp read | 00:00:34.861 | 0.0% | 888406 | 0.013 | 0.039 | 0.064 |
| overview write | 00:00:01.339 | 0.0% | 239348 | 0.001 | 0.006 | 0.014 |
| perl filter | 00:00:22.247 | 0.0% | 499580 | 0.015 | 0.045 | 0.093 |
| python filter | 00:00:23.075 | 0.0% | 499580 | 0.015 | 0.046 | 0.084 |
| site send | 00:00:10.533 | 0.0% | 612667 | 0.008 | 0.017 | 0.101 |
| TOTAL: 23:50:26.147 | 23:47:00.776 | 99.8% | - | - | - | - |
INNfeed timer:
| Code region | Time | Pct | Invoked | Min(ms) | Avg(ms) | Max(ms) |
|---|---|---|---|---|---|---|
| article new | 00:00:00.466 | 0.0% | 134201 | 0.000 | 0.003 | 0.010 |
| article prepare | 00:00:00.000 | 0.0% | 502 | 0.000 | 0.000 | 0.000 |
| article read | 00:00:00.023 | 0.0% | 331 | 0.000 | 0.069 | 1.000 |
| backlog stats | 00:00:00.446 | 0.0% | 410243 | 0.000 | 0.001 | 0.003 |
| callbacks | 00:00:00.000 | 0.0% | 0 | 0.000 | 0.000 | 0.000 |
| data read | 00:00:07.284 | 0.0% | 266155 | 0.019 | 0.027 | 0.064 |
| data write | 00:00:07.217 | 0.0% | 148250 | 0.014 | 0.049 | 0.090 |
| idle | 23:51:41.748 | 100.0% | 410243 | 117.585 | 209.392 | 433.871 |
| status file | 00:00:00.314 | 0.0% | 307 | 0.000 | 1.023 | 14.000 |
| TOTAL: 23:52:11.472 | 23:51:57.498 | 100.0% | - | - | - | - |
nnrpd timer:
| Code region | Time | Pct | Invoked | Min(ms) | Avg(ms) | Max(ms) |
|---|---|---|---|---|---|---|
| idle | 00:00:00.000 | 0.0% | 0 | 0.000 | 0.000 | 0.000 |
| newnews | 00:00:00.000 | 0.0% | 0 | 0.000 | 0.000 | 0.000 |
| nntpwrite | 00:00:00.003 | 0.1% | 11 | 0.000 | 0.273 | 1.000 |
| TOTAL: 00:00:02.015 | 00:00:00.003 | 0.1% | - | - | - | - |
Control commands to INND:
| Command | Number |
|---|---|
| flush | 5 |
| flushlogs | 2 |
| go | 2 |
| logmode | 2 |
| lowmark | 1 |
| mode | 147 |
| name | 2 |
| pause | 2 |
| paused | 2 |
| reload | 48 |
| reserve | 2 |
| TOTAL: 11 | 215 |
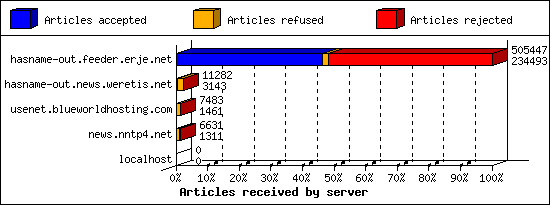
Incoming Feeds (INN):
| Server | Connects | Offered | Taken | Refused | Reject | %Accpt | Elapsed | |
|---|---|---|---|---|---|---|---|---|
| 1 | hasname-out.feeder.erje.net | 289 | 505447 | 234493 | 8752 | 262202 | 46% | 24:30:16 |
| 2 | hasname-out.news.weretis.net | 5 | 11282 | 3143 | 8071 | 68 | 27% | 45:58:29 |
| 3 | usenet.blueworldhosting.com | 717 | 7483 | 1461 | 5579 | 443 | 19% | 23:40:37 |
| 4 | news.nntp4.net | 2 | 6631 | 1311 | 4764 | 556 | 19% | 20:27:21 |
| 5 | localhost | 1 | 0 | 0 | 0 | 0 | 0% | 00:00:00 |
| TOTAL: 5 | 1014 | 530843 | 240408 | 27166 | 263269 | 45% | 114:36:43 | |
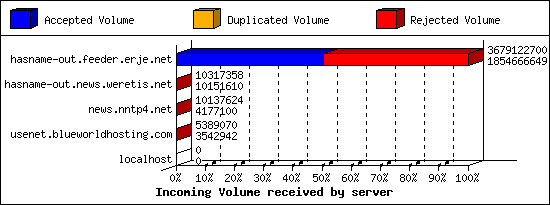
Incoming Volume (INN):
| Server | AcceptVol | DupVol | RejVol | TotalVol | %Acc | Vol/Art | |
|---|---|---|---|---|---|---|---|
| 1 | hasname-out.feeder.erje.net | 1.7 GB | 105.4 KB | 1.7 GB | 3.4 GB | 50% | 7.2 KB |
| 2 | hasname-out.news.weretis.net | 9.7 MB | 38.0 KB | 123.8 KB | 9.8 MB | 98% | 3.1 KB |
| 3 | news.nntp4.net | 4.0 MB | 38.1 KB | 5.6 MB | 9.7 MB | 41% | 5.3 KB |
| 4 | usenet.blueworldhosting.com | 3.4 MB | 0.0 KB | 1.8 MB | 5.1 MB | 65% | 2.8 KB |
| 5 | localhost | 0.0 KB | 0.0 KB | 0.0 KB | 0.0 KB | 0% | 0 |
| TOTAL: 5 | 1.7 GB | 181.6 KB | 1.7 GB | 3.5 GB | 50% | 7.2 KB | |
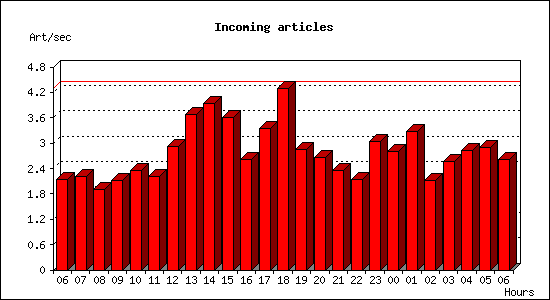
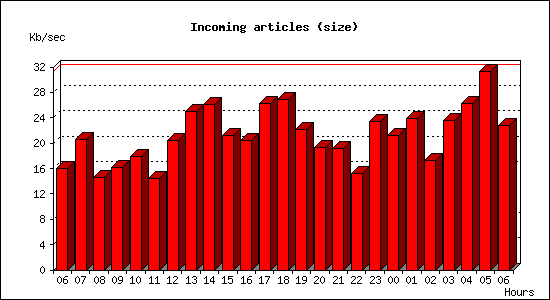
Incoming articles:
| Date | Articles | %Arts | Art/sec | Size | %Size | KB/sec |
|---|---|---|---|---|---|---|
| Sep 22 06:01:02 - 06:59:59 | 7599 | 3.2% | 2.15 | 55.4 MB | 3.1% | 16.03 |
| Sep 22 07:00:00 - 07:59:59 | 7942 | 3.3% | 2.21 | 72.4 MB | 4.1% | 20.59 |
| Sep 22 08:00:00 - 08:59:59 | 6868 | 2.9% | 1.91 | 51.1 MB | 2.9% | 14.54 |
| Sep 22 09:00:00 - 09:59:59 | 7634 | 3.2% | 2.12 | 56.6 MB | 3.2% | 16.09 |
| Sep 22 10:00:00 - 10:59:59 | 8472 | 3.5% | 2.35 | 62.7 MB | 3.5% | 17.85 |
| Sep 22 11:00:00 - 11:59:59 | 7950 | 3.3% | 2.21 | 50.5 MB | 2.8% | 14.35 |
| Sep 22 12:00:00 - 12:59:59 | 10526 | 4.4% | 2.92 | 71.6 MB | 4.0% | 20.38 |
| Sep 22 13:00:00 - 13:59:59 | 13243 | 5.5% | 3.68 | 87.7 MB | 4.9% | 24.96 |
| Sep 22 14:00:00 - 14:59:59 | 14149 | 5.9% | 3.93 | 91.9 MB | 5.1% | 26.13 |
| Sep 22 15:00:00 - 15:59:59 | 12981 | 5.4% | 3.61 | 74.3 MB | 4.2% | 21.13 |
| Sep 22 16:00:00 - 16:59:59 | 9413 | 3.9% | 2.61 | 71.5 MB | 4.0% | 20.34 |
| Sep 22 17:00:00 - 17:59:59 | 12004 | 5.0% | 3.33 | 92.2 MB | 5.2% | 26.22 |
| Sep 22 18:00:00 - 18:59:59 | 15470 | 6.4% | 4.30 | 94.4 MB | 5.3% | 26.86 |
| Sep 22 19:00:00 - 19:59:59 | 10238 | 4.3% | 2.84 | 77.8 MB | 4.4% | 22.14 |
| Sep 22 20:00:00 - 20:59:59 | 9573 | 4.0% | 2.66 | 67.6 MB | 3.8% | 19.23 |
| Sep 22 21:00:00 - 21:59:59 | 8486 | 3.5% | 2.36 | 67.6 MB | 3.8% | 19.23 |
| Sep 22 22:00:00 - 22:59:59 | 7699 | 3.2% | 2.14 | 53.4 MB | 3.0% | 15.18 |
| Sep 22 23:00:00 - 23:59:59 | 10936 | 4.5% | 3.04 | 82.4 MB | 4.6% | 23.44 |
| Sep 23 00:00:00 - 00:59:59 | 10077 | 4.2% | 2.80 | 74.4 MB | 4.2% | 21.17 |
| Sep 23 01:00:00 - 01:59:59 | 11780 | 4.9% | 3.27 | 84.1 MB | 4.7% | 23.92 |
| Sep 23 02:00:00 - 02:59:59 | 7591 | 3.2% | 2.11 | 60.8 MB | 3.4% | 17.29 |
| Sep 23 03:00:00 - 03:59:59 | 9240 | 3.8% | 2.57 | 82.7 MB | 4.6% | 23.53 |
| Sep 23 04:00:00 - 04:59:59 | 10149 | 4.2% | 2.82 | 92.3 MB | 5.2% | 26.24 |
| Sep 23 05:00:00 - 05:59:59 | 10436 | 4.3% | 2.90 | 109.8 MB | 6.1% | 31.22 |
| Sep 23 06:00:00 - 06:01:01 | 160 | 0.1% | 2.62 | 1.4 MB | 0.1% | 22.79 |
| TOTAL: 23:59:59 | 240616 | 100.0% | 2.78 | 1.7 GB | 100.0% | 21.17 |
CNFS buffer status:
| Buffer | Class | Size | Used | %Used | Cycles | KB/sec | Days |
|---|---|---|---|---|---|---|---|
| C1 | DEFAULT | 10.0 GB | 1.4 GB | 14.4% | 179 | 26.91 | 4.51 |
| TOTAL: 1 | - | 10.0 GB | 1.4 GB | 14.4% | 179 | 26.91 | - |
Sites sending bad articles:
| Server | Total | Group | Dist | Duplic | Unapp | TooOld | Site | Line | Other | |
|---|---|---|---|---|---|---|---|---|---|---|
| 1 | hasname-out.feeder.erje.net | 262279 | 262260 | 0 | 16 | 0 | 0 | 0 | 0 | 3 |
| 2 | news.nntp4.net | 604 | 595 | 0 | 9 | 0 | 0 | 0 | 0 | 0 |
| 3 | usenet.blueworldhosting.com | 443 | 443 | 0 | 0 | 0 | 0 | 0 | 0 | 0 |
| 4 | hasname-out.news.weretis.net | 93 | 59 | 0 | 9 | 0 | 0 | 0 | 0 | 25 |
| TOTAL: 4 | 263419 | 263357 | 0 | 34 | 0 | 0 | 0 | 0 | 28 | |
Unwanted newsgroups [Top 20]:
| Newsgroup | Count |
|---|---|
| alt.binaries.friends | 184539 |
| alt.binaries.pwp | 4334 |
| alt.binaries.amazing | 4019 |
| alt.binaries.u-4all | 3931 |
| alt.binaries.fta | 3206 |
| alt.binaries.ath | 2448 |
| alt.binaries.u4e | 2377 |
| alt.binaries.ghosts | 2188 |
| alt.binaries.flowed | 2166 |
| alt.binaries.font | 2104 |
| alt.binaries.town | 2062 |
| alt.binaries.big | 1999 |
| alt.binaries.storage | 1994 |
| alt.binaries.usenetrevolution | 1948 |
| alt.binaries.encrypted | 1746 |
| alt.binaries.wtfnzb.charlie | 1343 |
| alt.binaries.wtfnzb.golf | 1305 |
| alt.binaries.wtfnzb.lima | 1302 |
| alt.binaries.wtfnzb.mike | 1302 |
| alt.binaries.wtfnzb.india | 1291 |
| TOTAL: 186 | 263357 |
INND no permission servers:
| System | Conn |
|---|---|
| 103.193.138.76 | 30 |
| 162.216.149.66 | 2 |
| 66.132.195.104 | 2 |
| 185.247.137.93 | 1 |
| 195.96.139.108 | 1 |
| 66.132.195.119 | 1 |
| 85.217.149.56 | 1 |
| TOTAL: 7 | 38 |
Miscellaneous innd statistics [Top 10]:
| Event | Server | Number |
|---|---|---|
| Bad Message-ID's offered | ||
| hasname-out.feeder.erje.net | 2 | |
| TOTAL: 1 | 2 | |
| Including strange strings | ||
| hasname-out.news.weretis.net | 25 | |
| hasname-out.feeder.erje.net | 3 | |
| TOTAL: 2 | 28 | |
| TOTAL: 2 | 30 | |
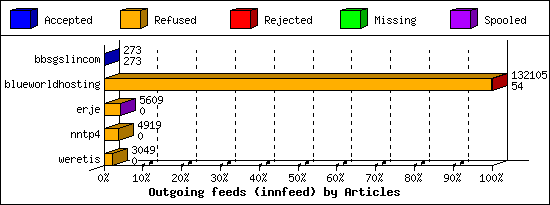
Outgoing Feeds (innfeed) by Articles:
| Server | Offered | Taken | Refused | Reject | Miss | Spool | %Took | Elapsed | |
|---|---|---|---|---|---|---|---|---|---|
| 1 | bbsgslincom | 273 | 273 | 0 | 0 | 0 | 0 | 100% | 18:37:45 |
| 2 | blueworldhosting | 134118 | 54 | 132050 | 1 | 0 | 0 | 0% | 23:52:08 |
| 3 | erje | 5615 | 0 | 5594 | 2 | 0 | 13 | 0% | 23:51:10 |
| 4 | nntp4 | 4923 | 0 | 4919 | 0 | 0 | 0 | 0% | 23:52:08 |
| 5 | weretis | 3052 | 0 | 3049 | 0 | 0 | 0 | 0% | 23:52:08 |
| TOTAL: 5 | 147981 | 327 | 145612 | 3 | 0 | 13 | 0% | 114:05:19 | |
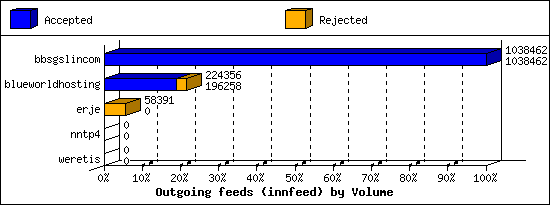
Outgoing Feeds (innfeed) by Volume:
| Server | AcceptVol | RejectVol | TotalVol | Volume/sec | Vol/Art | Elapsed | |
|---|---|---|---|---|---|---|---|
| 1 | bbsgslincom | 1014.1 KB | 0.0 KB | 1014.1 KB | 0.0 KB/s | 3.7 KB | 18:37:45 |
| 2 | blueworldhosting | 191.7 KB | 27.4 KB | 219.1 KB | 0.0 KB/s | 4.0 KB | 23:52:08 |
| 3 | erje | 0.0 KB | 57.0 KB | 57.0 KB | 0.0 KB/s | 28.5 KB | 23:51:10 |
| 4 | nntp4 | 0.0 KB | 0.0 KB | 0.0 KB | 0.0 KB/s | 0 | 23:52:08 |
| 5 | weretis | 0.0 KB | 0.0 KB | 0.0 KB | 0.0 KB/s | 0 | 23:52:08 |
| TOTAL: 5 | 1.2 MB | 84.5 KB | 1.3 MB | 0.0 KB/s | 3.9 KB | 114:05:19 | |
NNRP total resource statistics [Top 20]:
| System | User(ms) | System(ms) | Idle(ms) | Elapsed |
|---|---|---|---|---|
| r4-240-f0.monitoring.internet-measurement.com | 0.001 | 0.003 | 0.000 | 00:00:00 |
| azpdsgufs84z.stretchoid.com | 0.002 | 0.005 | 0.000 | 00:00:00 |
| 194-50-235-154.infrawat.ch | 0.002 | 0.002 | 0.000 | 00:00:00 |
| 62.146.94.167.censys-scanner.com | 0.002 | 0.004 | 0.000 | 00:00:00 |
| o056.scanner.modat.io | 0.000 | 0.002 | 0.000 | 00:00:00 |
| 154-16-44-14.infrawat.ch | 0.000 | 0.004 | 0.000 | 00:00:00 |
| 102.195.132.66.censys-scanner.com | 0.000 | 0.004 | 0.000 | 00:00:00 |
| 147.185.132.99 | 0.000 | 0.004 | 0.000 | 00:00:00 |
| TOTAL: 8 | 0.007 | 0.028 | 0.000 | 00:00:02 |
NNRP no permission clients [Top 20]:
| System | Conn |
|---|---|
| 62.146.94.167.censys-scanner.com | 3 |
| azpdsgufs84z.stretchoid.com | 2 |
| 102.195.132.66.censys-scanner.com | 1 |
| 147.185.132.99 | 1 |
| 154-16-44-14.infrawat.ch | 1 |
| 194-50-235-154.infrawat.ch | 1 |
| o056.scanner.modat.io | 1 |
| r4-240-f0.monitoring.internet-measurement.com | 1 |
| TOTAL: 8 | 11 |